empty
31.01.2023 11:32 AM
EUR/USD and GBP/USD technical analysis on January 31, 2023

EUR/USD

This image is no longer relevant

Higher time frames

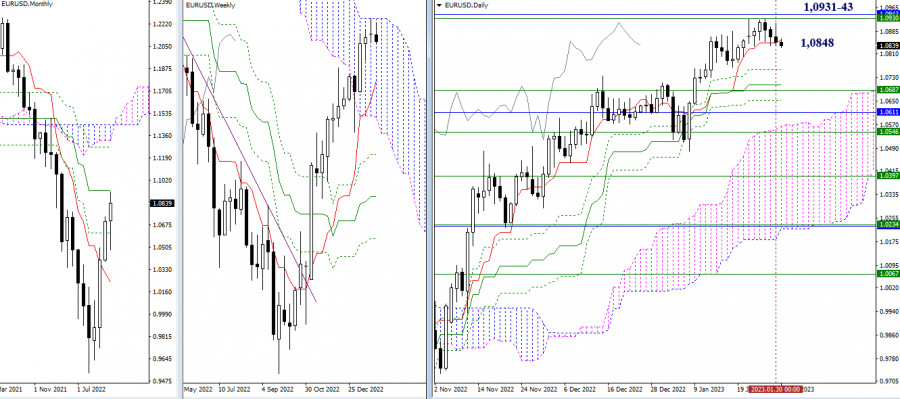
The situation has not changed much over the past 24 hours. The pair is still holding near the support level of the daily short-term trend (1.0848). Consolidation below this level and a further decline will bring the price to the lower levels of the daily Ichimoku Cross at 1.0759 – 1.0706 – 1.0653 and the weekly short-term trend at 1.0687. The bearish scenario is more likely in current conditions for various reasons. If bulls return to the market at some point, their main target will be the key resistance of 1.0931-43 (upper boundary of the weekly Ichimoku Cloud + monthly medium-term trend).

This image is no longer relevant

H4 – H1

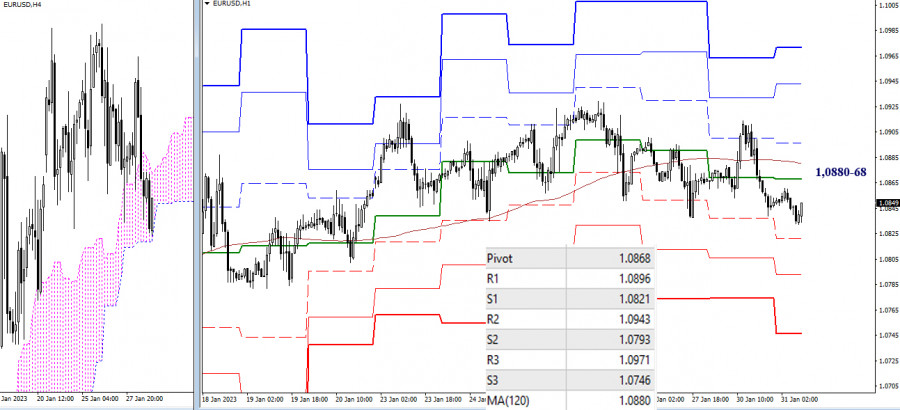
Bears are taking over the pair on lower time frames. The pair is currently trading below the central pivot level of 1.0868 and the weekly long-term trend of 1.0880. The next downward targets on the intraday chart are found at the support of standard pivot levels of 1.0821 – 1.0793 – 1.0746. A breakout of the Ichimoku Cloud on H4 and consolidation in the selling zone will support the bearish trend and will send the price for a new breakout.

***

GBP/USD

This image is no longer relevant

Higher time frames

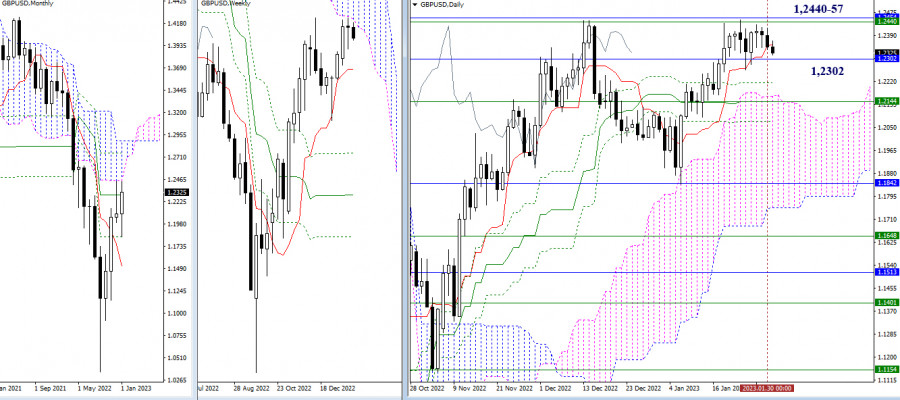
The daily short-term trend has slightly shifted from the level of 1.2302. The pair is still trading in the range between 1.2457-40 (upper boundaries of Ichimoku Clouds on monthly and weekly time frames) and 1.2302 (monthly medium-term trend). If the price leaves these boundaries, it may develop a new trajectory.

This image is no longer relevant

H4 – H1

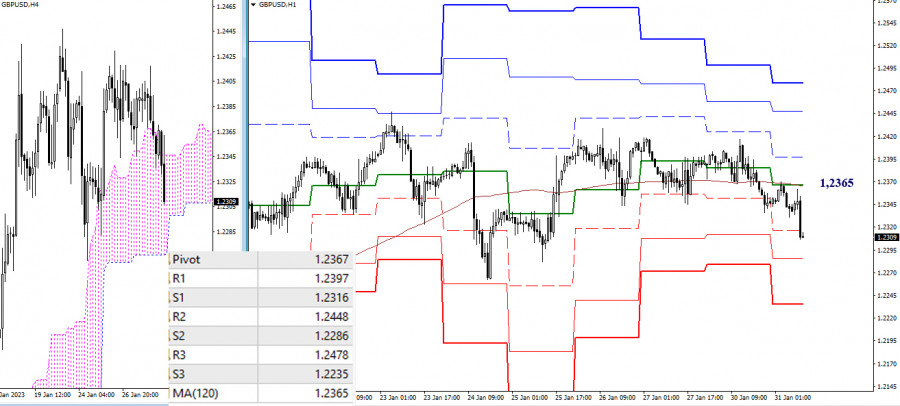
On lower time frames, the price has slipped below the key levels found at 1.2367-65 (central pivot level + weekly long-term trend). Trading below this range will support the sellers. Other intraday targets for bears are located at standard pivot levels of 1.2286 and 1.2235 as well as at the lower boundary of the cloud on H4. If the price settles outside the H4 cloud, it may head lower for new downward targets.

***

Technical analysis is based on:

Higher time frames – Ichimoku Kinko Hyo (9.26.52) + Fibo Kijun levels

Lower time frames – H1: Pivot Points (standard) + 120-day Moving Average (weekly long-term trend)

Evangelos Poulakis,
الخبير التحليلي لدى شركة إنستافوركس
© 2007-2025
حدد الإطار الزمني
5
د
15
د
30
د
1
س
4
ساعات
1
يوم
1
أسبوع
كسب عائد من تغيرات أسعار العملات المشفرة مع إنستافوركس.
قم بتحميل منصة التداول ميتاتريدر 4 وافتح أول صفقة.
  • إيداع الحظ
    قم بإيداع 3,000 دولار في حسابك واحصل على $1,000 وأكثر من ذالك!
    في أبريل نحن نقدم باليانصيب $1,000 ضمن حملة إيداع الحظ!
    احصل على فرصة للفوز من خلال إيداع 3,000 دولار في حساب تداول. بعد أن استوفيت هذا الشرط، تصبح مشاركًا في الحملة.
    انضم إلى المسابقة

المقالات الموصى بها

إشارات التداول للذهب (XAU/USD) للفترة من 10 إلى 12 أبريل 2025: البيع تحت مستوى 3,145 دولار (21 SMA - 8/8 Murray)

في بداية الجلسة الأمريكية، يتداول الذهب حول مستوى 3,120 بالقرب من 8/8 موراي، حيث يصل إلى مستويات المقاومة. نعتقد أن الذهب قد يشهد تصحيحًا تقنيًا قويًا في الساعات القادمة

Dimitrios Zappas 15:37 2025-04-10 UTC+2

اليورو/الدولار الأمريكي. 10 أبريل. ترامب يواصل هز الأسواق

يوم الأربعاء، قام زوج اليورو/الدولار الأمريكي بارتدادين من منطقة المقاومة 1.1081–1.1095، مما أدى إلى تحول لصالح الدولار الأمريكي وانخفاض نحو منطقة الدعم 1.0944–1.0957. الارتداد من هذه المنطقة سيكون لصالح اليورو

Samir Klishi 12:19 2025-04-10 UTC+2

التوقعات لزوج الجنيه الإسترليني/الدولار الأمريكي في 10 أبريل 2025

على الرسم البياني للساعة، ارتد زوج الجنيه الإسترليني/الدولار الأمريكي من مستوى 1.2865 يوم الأربعاء، وشهد انخفاضًا طفيفًا، وعاد اليوم إلى نفس المستوى. ارتداد آخر من هذا المستوى سيكون في صالح

Samir Klishi 12:12 2025-04-10 UTC+2

توقعات الفوركس 10/04/2025: اليورو/الدولار الأمريكي، SP500، NASDAQ، داو جونز، USDX وبيتكوين

روابط مفيدة: مقالاتي الأخرى متوفرة في هذا القسم دورة InstaForex للمبتدئين التحليلات الشائعة افتح حساب تداول مهم: يجب على المبتدئين في تداول الفوركس أن يكونوا حذرين للغاية عند اتخاذ قرارات

Sebastian Seliga 11:35 2025-04-10 UTC+2

التحليل الفني لحركة السعر اللحظية لمؤشر Nasdaq 100، الخميس 10 أبريل 2025.

من الواضح من الرسم البياني لمدة 4 ساعات لمؤشر Nasdaq 100، أنه على الرغم من وجود تعزيز حالي في #NDX، يتم تأكيد ذلك من خلال حركة السعر التي تتحرك

Arief Makmur 10:14 2025-04-10 UTC+2

التحليل الفني لحركة السعر اليومية لأزواج العملات الغريبة USD/IDR، الخميس 10 أبريل 2025.

على الرسم البياني اليومي، يبدو أن زوج العملات الغريب USD/IDR يمتلك انحيازًا صعوديًا قويًا إلى حد ما، وهو ما يُشار إليه بحركة السعر التي تتحرك فوق المتوسط المتحرك الأسي (21)،

Arief Makmur 10:14 2025-04-10 UTC+2

USD/JPY: تباطؤ التضخم في الولايات المتحدة قد يضغط على الزوج

انخفض الين الياباني بشكل كبير في اليوم السابق بسبب أخبار غير متوقعة عن توقف لمدة 90 يومًا في الحروب التجارية. هذا التطور دعم الدولار، لكن ما إذا كان نموه سيستمر

Pati Gani 09:56 2025-04-10 UTC+2

توقعات اليورو/الدولار الأمريكي ليوم 10 أبريل 2025

أمس، قام الرئيس الأمريكي دونالد ترامب بتخفيض التعريفات الجمركية إلى 10% لمدة 90 يومًا للدول التي لم ترد على التعريفات الأمريكية الأولية (أكثر من 75 دولة في المجموع). وفي الوقت

Laurie Bailey 05:08 2025-04-10 UTC+2

توقعات GBP/USD ليوم 10 أبريل 2025

يوم الأربعاء، عمل الجنيه الإسترليني بشكل كامل ضمن النطاق المستهدف 1.2816/47، ولكن كما كان متوقعًا، لم يتمكن من التماسك فوق هذا النطاق، بل دخل في مرحلة تماسك حول هذه المنطقة

Laurie Bailey 05:08 2025-04-10 UTC+2

توقعات USD/JPY ليوم 10 أبريل 2025

لم تتمكن التقلبات المتزايدة في زوج USD/JPY يوم أمس من تغيير الاتجاه الهبوطي - حيث لم يغلق جسم الشمعة فوق خط التوازن. وقد شهدنا هذا الصباح انخفاضًا كاد أن يبتلع

Laurie Bailey 05:08 2025-04-10 UTC+2
لا تستطيع التحدث الآن؟
اطرح سؤالك في الدردشة.
Widget callback
 

Dear visitor,

Your IP address shows that you are currently located in the USA. If you are a resident of the United States, you are prohibited from using the services of InstaFintech Group including online trading, online transfers, deposit/withdrawal of funds, etc.

If you think you are seeing this message by mistake and your location is not the US, kindly proceed to the website. Otherwise, you must leave the website in order to comply with government restrictions.

Why does your IP address show your location as the USA?

  • - you are using a VPN provided by a hosting company based in the United States;
  • - your IP does not have proper WHOIS records;
  • - an error occurred in the WHOIS geolocation database.

Please confirm whether you are a US resident or not by clicking the relevant button below. If you choose the wrong option, being a US resident, you will not be able to open an account with InstaForex anyway.

We are sorry for any inconvenience caused by this message.