EUR/USD 5-Minute Analysis
The EUR/USD currency pair experienced significant price fluctuations on Wednesday, following a notable downward trend. The only major event that contributed to this volatility was the release of the U.S. inflation report. Although Jerome Powell's second testimony before Congress occurred on the same day, it clearly did not influence the extreme price movements we observed.
Regarding the inflation report, both the core and headline Consumer Price Index (CPI) rose in January, which was unexpected by the market, as analysts did not anticipate an increase in either metric. This marks the fourth consecutive month of rising inflation in the U.S., delivering a clear message to traders: the next Federal Reserve rate cut is unlikely to occur anytime soon. In fact, the Federal Reserve may only implement one rate cut in 2025, or possibly choose to maintain current rates throughout the year. This outlook continues to provide strong support for the U.S. dollar.
From a technical perspective, the hourly chart is so chaotic that it might be advisable to disregard it altogether. The price movements are disorganized, with frequent trend reversals—a situation we had previously cautioned about. Yesterday's market activity demonstrated that the market remains committed to a correction in the daily timeframe. The dollar initially surged, but this was followed by an even more pronounced decline, despite a lack of fundamental justification for such a move. This confirms that the upward correction is still ongoing and that the market is not yet prepared to resume the broader downtrend.
On the 5-minute timeframe, the trading signals were not even worth considering. They appeared in a zone where two Ichimoku indicator lines and two support/resistance levels were clustered. Short positions after breaking below this area were no longer viable since by that time, the price had already moved 50 pips within five minutes. Long positions also didn't make sense, as any rally is still just a correction, and the macroeconomic background continues to support the dollar. In any case, entering at any signal would have required a Stop Loss set far from the entry points due to the volatility.
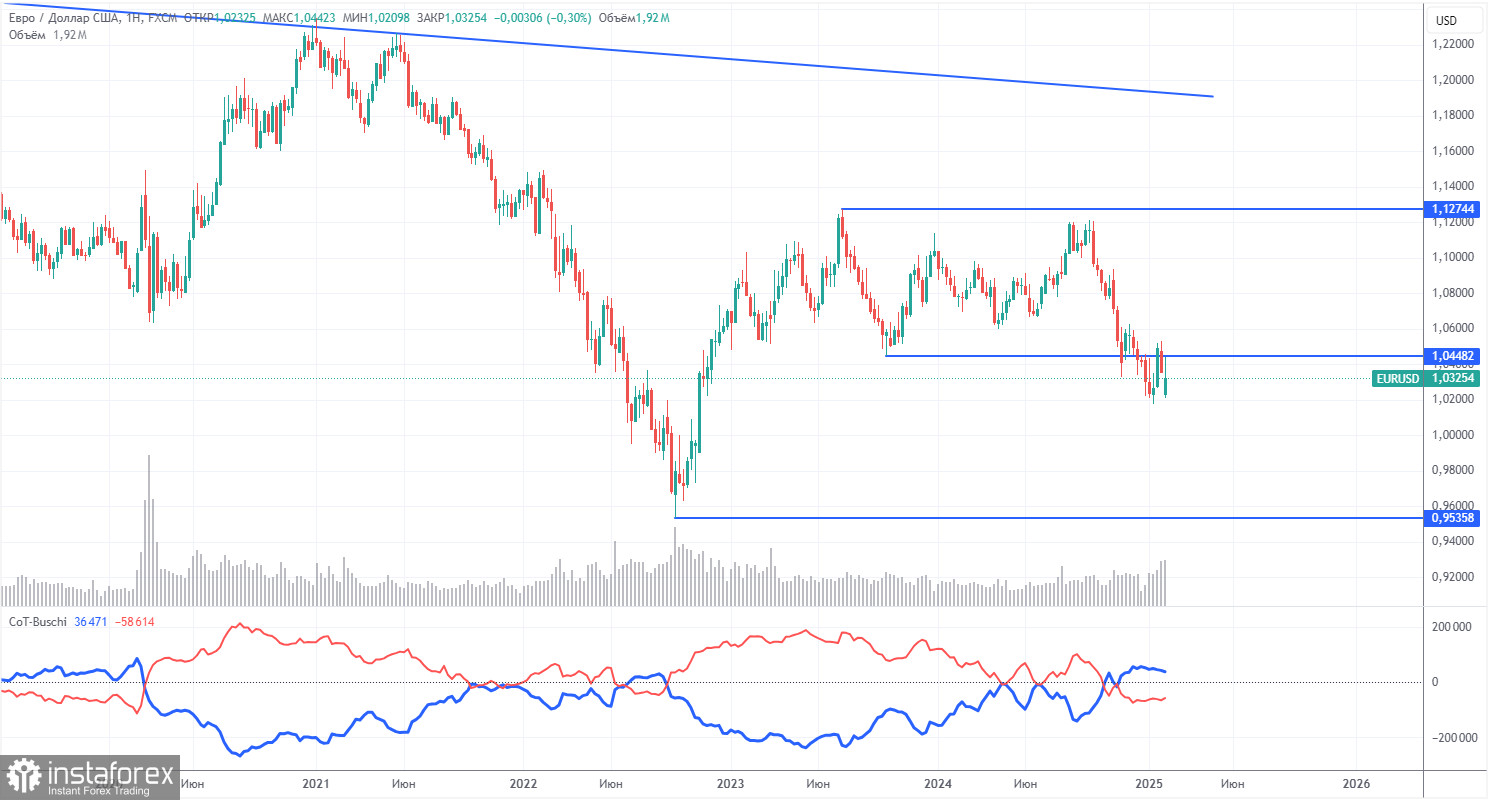
COT Report
The latest Commitments of Traders (COT) report, dated February 4, confirms a shift toward bearish sentiment in the market. The accompanying chart clearly illustrates that non-commercial traders maintained a bullish net position for an extended period, but bears have now taken control.
Two months ago, there was a significant increase in the number of short positions opened by institutional traders. For the first time in a long while, the net position has turned negative, indicating that the euro is now being sold more frequently than it is bought.
Currently, there are no fundamental factors that support a sustained rally in the euro. The recent bullish movement observed on the weekly timeframe is quite minimal, suggesting that it is merely a pullback. While this correction could last for several more weeks, it does not undermine the long-term 16-year downtrend.
At present, the red and blue lines have crossed and reversed their positions relative to each other, confirming a bearish trend in the market. Over the past reporting week, the number of long positions in the non-commercial category increased by 8,900, while the number of short positions rose by only 900. As a result, the net position increased by 8,000 contracts, but this change does not alter the overarching bearish trend.
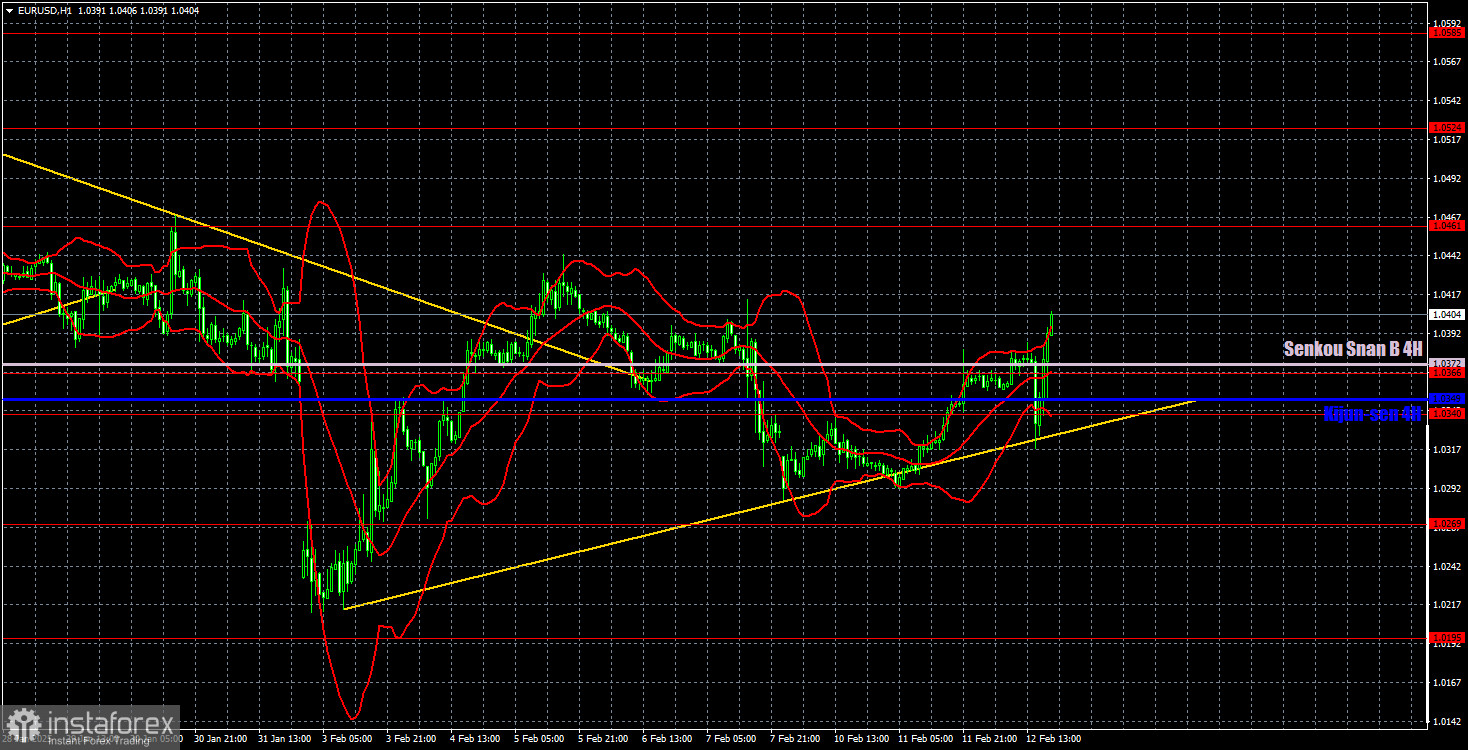
EUR/USD 1-Hour Analysis
On the hourly timeframe, the currency pair has completed its local downtrend, having breached the downward trendline and formed a new upward trendline. We anticipate that the decline will continue in the medium term, as the Federal Reserve may only cut rates once or twice in 2025. This represents a significantly more hawkish stance than what the market had previously expected. However, in the short term, we could see one or two additional upward trends. The euro currently lacks strong fundamental reasons for a rise, but the correction on the daily timeframe is too weak to be considered complete.
For February 13, we highlight the following trading levels: 1.0124, 1.0195, 1.0269, 1.0340-1.0366, 1.0461, 1.0524, 1.0585, 1.0658-1.0669, 1.0757, 1.0797, and 1.0843, along with the Senkou Span B (1.0372) and Kijun-sen (1.0349) lines. Please note that the Ichimoku indicator lines may shift throughout the day, which should be considered when identifying trading signals. Remember to set a Stop Loss at breakeven if the price moves 15 pips in the favorable direction, as this will help mitigate potential losses in case of a false signal.
On Thursday, the Eurozone economic calendar includes Germany's inflation report and industrial production data, although these reports are not the most critical. In the U.S., weaker data is also scheduled for release, including the Producer Price Index (PPI) and jobless claims.
Illustration Explanations:
- Support and Resistance Levels (thick red lines): Thick red lines indicate where movement may come to an end. Please note that these lines are not sources of trading signals.
- Kijun-sen and Senkou Span B Lines: Ichimoku indicator lines transferred from the 4-hour timeframe to the hourly timeframe. These are strong lines.
- Extreme Levels (thin red lines): Thin red lines where the price has previously bounced. These serve as sources of trading signals.
- Yellow Lines: Trendlines, trend channels, or any other technical patterns.
- Indicator 1 on COT Charts: Represents the net position size for each category of traders.