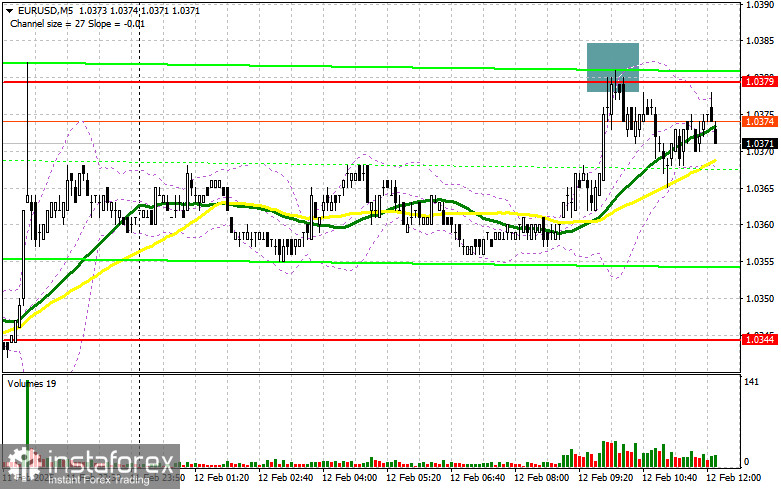
In my morning forecast, I highlighted the 1.0379 level as a key point for making trading decisions. Looking at the 5-minute chart, the rise and subsequent false breakout around 1.0379 provided a solid entry point for short positions, leading to a 15-point decline before selling pressure eased. The technical outlook for the second half of the day remains unchanged.
Opening Long Positions on EUR/USD:
The absence of economic data from the eurozone once again allowed the euro to recover slightly, but overall demand for the pair has yet to return. This may be due to the key U.S. economic data expected later today. Crucial inflation figures, including the Consumer Price Index (CPI) and Core CPI (excluding food and energy), will be released for January. If inflation rises, the Fed is likely to keep interest rates unchanged at least until late summer, strengthening the dollar. Conversely, weaker inflation could support EUR/USD.
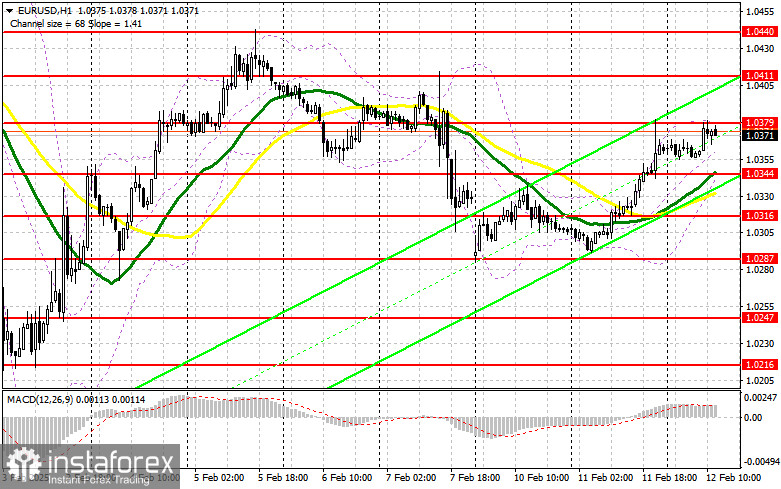
If the pair declines on strong U.S. data, I will look to enter long positions after a false breakout near the morning support at 1.0344, targeting a rise to the resistance at 1.0379, where trading is currently centered. A breakout and retest of this level, which was not achieved in the morning, will confirm a buying signal with potential targets at 1.0411. The most ambitious target is 1.0440, where I will take profit.
If EUR/USD declines and there is no bullish activity around 1.0344, buyers will lose momentum, allowing sellers to push the pair towards 1.0316. I will consider long positions only after a false breakout at this level. I will also look for buying opportunities on a direct rebound from 1.0287, targeting a 30-35 point intraday correction.
Opening Short Positions on EUR/USD:
Bears made an effort at 1.0379 but failed to trigger a major sell-off, indicating a wait-and-see approach from large traders. The best strategy is to continue selling from 1.0379 following strong U.S. economic data. Another false breakout at this level, similar to what occurred earlier, will confirm the presence of strong sellers and provide an entry point for shorts, aiming for the 1.0344 support, where the moving averages—favoring bulls—are located.
A breakout and consolidation below 1.0344, followed by a retest from below, will provide another selling opportunity, potentially leading to a drop to the new low at 1.0316, confirming a bearish market. The final downward target is 1.0287, where I will take profit.
If EUR/USD rises in the second half of the day and bears fail to defend 1.0379, buyers may push for a stronger rally. In this case, I will postpone short positions until the next resistance at 1.0411, where I will sell only after a failed breakout. I will consider short positions on an immediate rebound from 1.0440, targeting a 30-35 point correction.
Commitments of Traders (COT) Report:
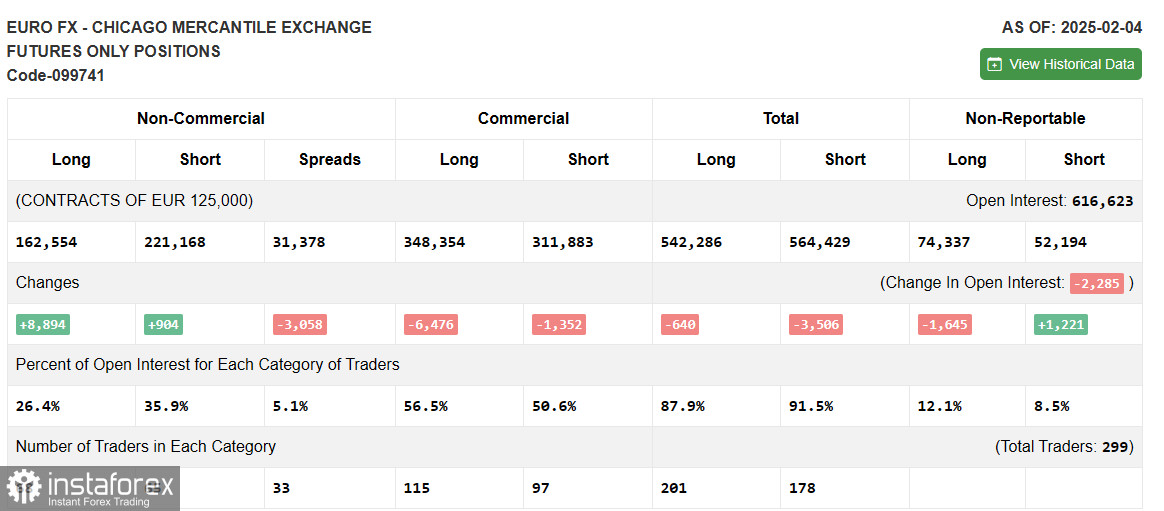
The COT report from February 4 showed an increase in both long and short positions. Interest in buying euros increased slightly as concerns about an escalated trade war under Donald Trump eased. However, this data does not yet account for the recent strong U.S. jobs report and new tariffs on steel and aluminum, making the outlook less straightforward. It is still too early to rush into risk assets, as the trade war is only beginning.
The report showed that long non-commercial positions rose by 8,894 to 162,554, while short non-commercial positions increased by just 904 to 221,168. As a result, the gap between long and short positions narrowed by 3,058 contracts.
Indicator Signals
Moving AveragesTrading remains above the 30- and 50-day moving averages, signaling further euro gains.
Note: The moving average periods and prices discussed are based on the hourly (H1) chart and may differ from the traditional daily (D1) moving averages.
Bollinger BandsIf the pair declines, the lower Bollinger Band around 1.0344 will act as support.
Indicator Descriptions:
- Moving Average (MA): Identifies the current trend by smoothing out volatility and noise.
- 50-period MA (yellow line on the chart)
- 30-period MA (green line on the chart)
- MACD (Moving Average Convergence/Divergence):
- Fast EMA: 12-period
- Slow EMA: 26-period
- Signal Line (SMA): 9-period
- Bollinger Bands: 20-period
- Non-commercial traders: Speculators such as individual traders, hedge funds, and large institutions using the futures market for speculative purposes.
- Long non-commercial positions: The total long open interest held by non-commercial traders.
- Short non-commercial positions: The total short open interest held by non-commercial traders.
- Net non-commercial position: The difference between non-commercial short and long positions.