empty
 
 
24.02.2025 04:38 PM
EUR/USD – February 24th: German Election Results Support the Bulls

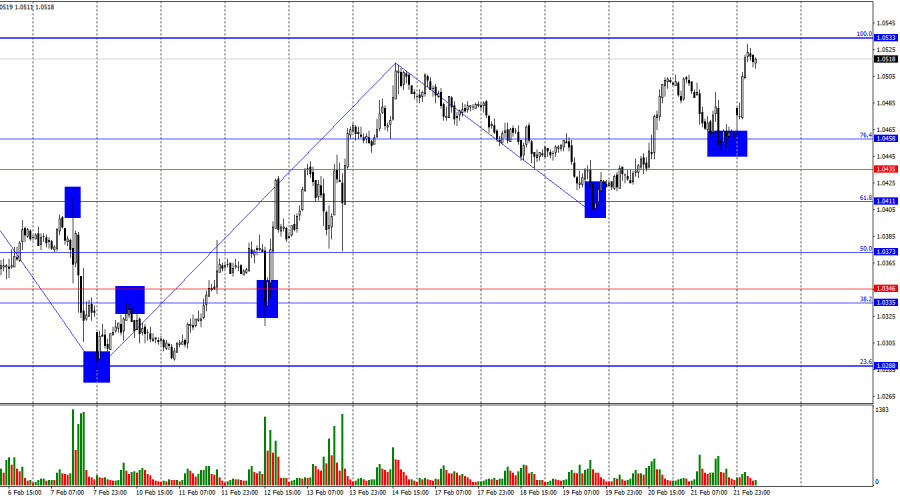
On Friday, the EUR/USD pair retraced to the 76.4% Fibonacci correction level at 1.0458, rebounded, and reversed in favor of the euro. On Monday, a strong rally began, driven by the German election results, pushing the pair toward the 100.0% Fibonacci level at 1.0533. A rejection from this level would favor the US dollar and lead to a pullback toward 1.0458. A break above 1.0533 would increase the likelihood of further growth toward the 127.2% Fibonacci level at 1.0620.

This image is no longer relevant

The wave pattern on the hourly chart has become somewhat ambiguous, yet recent price action suggests signs of a bullish trend. The last completed downward wave failed to break the previous low, while the latest upward wave surpassed the previous peak. This suggests that the market is in a bullish phase or a complex horizontal movement, which is more evident on the 4-hour chart. However, the size of the waves is inconsistent, leading to uncertainty regarding the strength of the trend.

On Friday, the fundamental backdrop negatively affected the euro, though this may not have been the main driver behind its decline. The PMI reports from Germany, the Eurozone, and the US were mixed, failing to provide a clear directional signal. Some Eurozone data showed weakness, but so did the US reports. Given the strong rally a day earlier, Friday's decline could have simply been a technical correction.

On Monday, the euro surged, reflecting the market's reaction to Germany's parliamentary elections, where the CDU-CSU alliance emerged victorious. This coalition, comprising the Christian Democratic Union and the Christian Social Union, means that Friedrich Merz will become Germany's new chancellor. Meanwhile, Olaf Scholz's party secured only 16.5% of the vote, placing third. The market has positively interpreted this political shift in Germany.

This image is no longer relevant

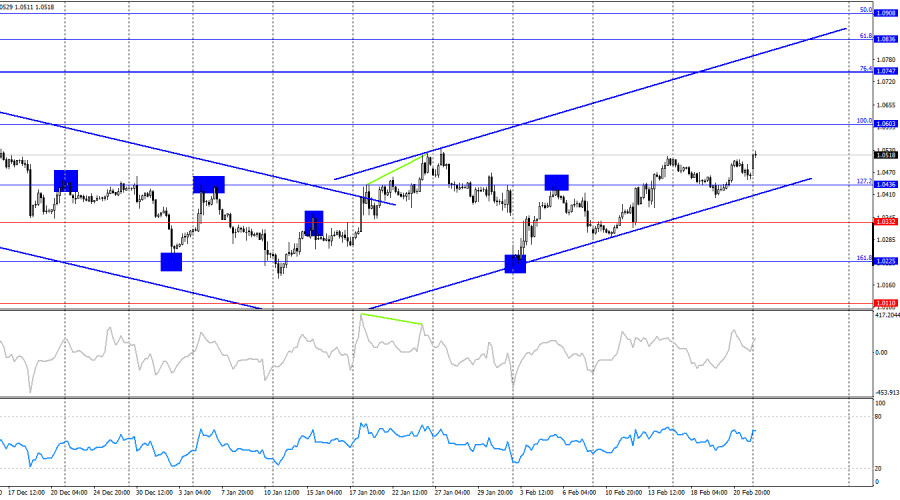
On the 4-hour chart, the pair returned to the 127.2% Fibonacci level at 1.0436 and consolidated above it. However, overall, price action in 2025 has been mostly sideways, indicating a range-bound market. The upward trend channel is largely symbolic, as the price does not strictly adhere to it. As of now, no divergence signals are visible on any indicators.

This image is no longer relevant

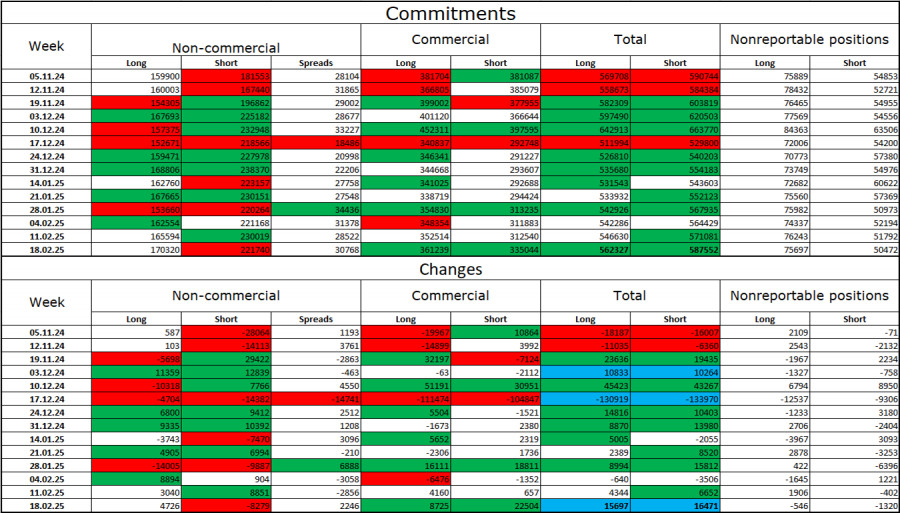
According to the latest Commitments of Traders (COT) report, professional traders opened 4,726 long positions while closing 8,279 short positions. The sentiment among non-commercial traders remains bearish. Currently, the total number of long positions held by speculators stands at 170,000, while short positions total 221,000.

For the past 21 weeks, large traders have been offloading euro positions, indicating a persistent bearish trend. While bullish dominance occasionally appears, these instances remain exceptions. The key driver of the dollar's weakness—expectations of FOMC monetary policy easing—has already been priced in, leaving the market with few reasons to sell the dollar further.

However, recent EU and US economic updates have allowed bulls to regain some momentum. While the bearish advantage is weakening, it is too early to call an end to the downtrend. Notably, long positions have been increasing for the past three weeks.

Economic Calendar for February 24

  • Eurozone – Consumer Price Index (CPI) (10:00 UTC)

The economic calendar for Monday includes only one event, and it is not particularly significant. The inflation report is a final revision for January, meaning that traders already know the preliminary figure. As a result, the impact on market sentiment is expected to be minimal.

EUR/USD Forecast & Trading Recommendations

Short positions were valid upon a rejection from 1.0458 on the hourly chart, targeting 1.0435 and 1.0411, both of which were achieved. New short positions can be considered upon a rejection from 1.0533, targeting 1.0458. Long positions were valid upon a bounce from 1.0458. New buying opportunities will arise if the pair consolidates above 1.0533, targeting 1.0620.

Fibonacci Levels in Use

  • Hourly Chart: 1.0533 – 1.0213
  • 4-Hour Chart: 1.0603 – 1.1214
Samir Klishi,
Analytical expert of InstaForex
© 2007-2025
Earn on cryptocurrency rate changes with InstaForex
Download MetaTrader 4 and open your first trade
  • Grand Choice
    Contest by
    InstaForex
    InstaForex always strives to help you
    fulfill your biggest dreams.
    JOIN CONTEST
  • Chancy Deposit
    Deposit your account with $3,000 and get $1000 more!
    In February we raffle $1000 within the Chancy Deposit campaign!
    Get a chance to win by depositing $3,000 to a trading account. Having fulfilled this condition, you become a campaign participant.
    JOIN CONTEST
  • Trade Wise, Win Device
    Top up your account with at least $500, sign up for the contest, and get a chance to win mobile devices.
    JOIN CONTEST
  • 100% Bonus
    Your unique opportunity to get a 100% bonus on your deposit
    GET BONUS
  • 55% Bonus
    Apply for a 55% bonus on your every deposit
    GET BONUS
  • 30% Bonus
    Receive a 30% bonus every time you top up your account
    GET BONUS

Recommended Stories

Can't speak right now?
Ask your question in the chat.
Widget callback