The EUR/USD currency pair remained range-bound for most of Thursday but resumed its upward movement following the European Central Bank's (ECB) meeting results. The market's initial reaction was a new round of euro purchases, despite the ECB predictably lowering all three key interest rates. To reiterate: the ECB had planned to cut rates, the ECB cut rates, yet the euro still appreciated. This encapsulates the current market's complete detachment from logical price action. Investors continue selling off the U.S. dollar simply because they want no part of it, and this reluctance stems from a single factor—Donald Trump. This has been a recurring theme all week. Even on Monday, the euro surged without any macroeconomic justification.
As the days pass, Trump continues making new announcements, and the market keeps ignoring all macroeconomic and fundamental data. At this point, it no longer matters what the ECB or the Federal Reserve plan to do in 2025, how strong the U.S. economy is, or how weak the European economy appears. Everything revolves around Trump.
A week ago, no one could have predicted such a sharp rally in the euro. Yet, here we are, acknowledging that Donald Trump alone has upended all technical, fundamental, and macroeconomic outlooks. The market anticipates a significant deterioration in U.S. relations with Canada, China, Mexico, the European Union, and even India. Many experts argue that Trump disregards decades-long diplomatic ties, preferring to antagonize traditional allies. For instance, Canada is now witnessing the rise of a "Boycott American Goods" movement, with multiple governors declaring that they will halt U.S. imports and cut electricity exports. This is a direct message to Washington that not everything in global affairs revolves around money. Friendship matters, and when a supposed ally exploits economic leverage, that relationship ceases to be one of mutual trust. As a result, America's global standing is beginning to shift.
One must consider that every country is fundamentally driven by its people. Canadians see that the once-friendly U.S. is now acting against their interests. What happens if they collectively decide to boycott American goods? How will U.S. manufacturers, who were supposed to benefit from Trump's tariffs, react when demand dries up? What if Europeans or Chinese consumers join in? At this point, Trump's actions appear to be sowing chaos into a system that functioned smoothly for years. Time will tell who benefits from this strategy, but most analysts now forecast an inevitable U.S. recession—one that even the Federal Reserve had managed to avoid thus far.
EUR/USD Technical Outlook
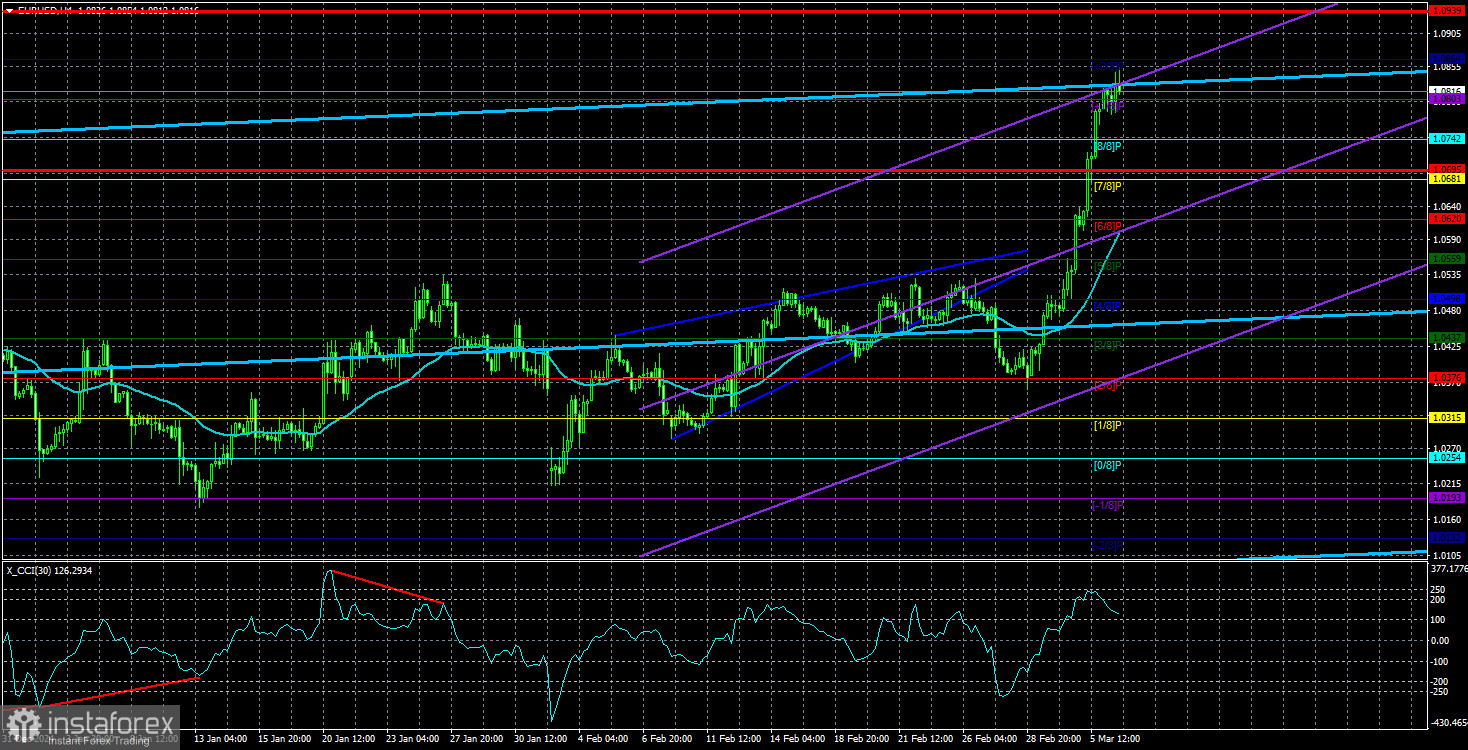
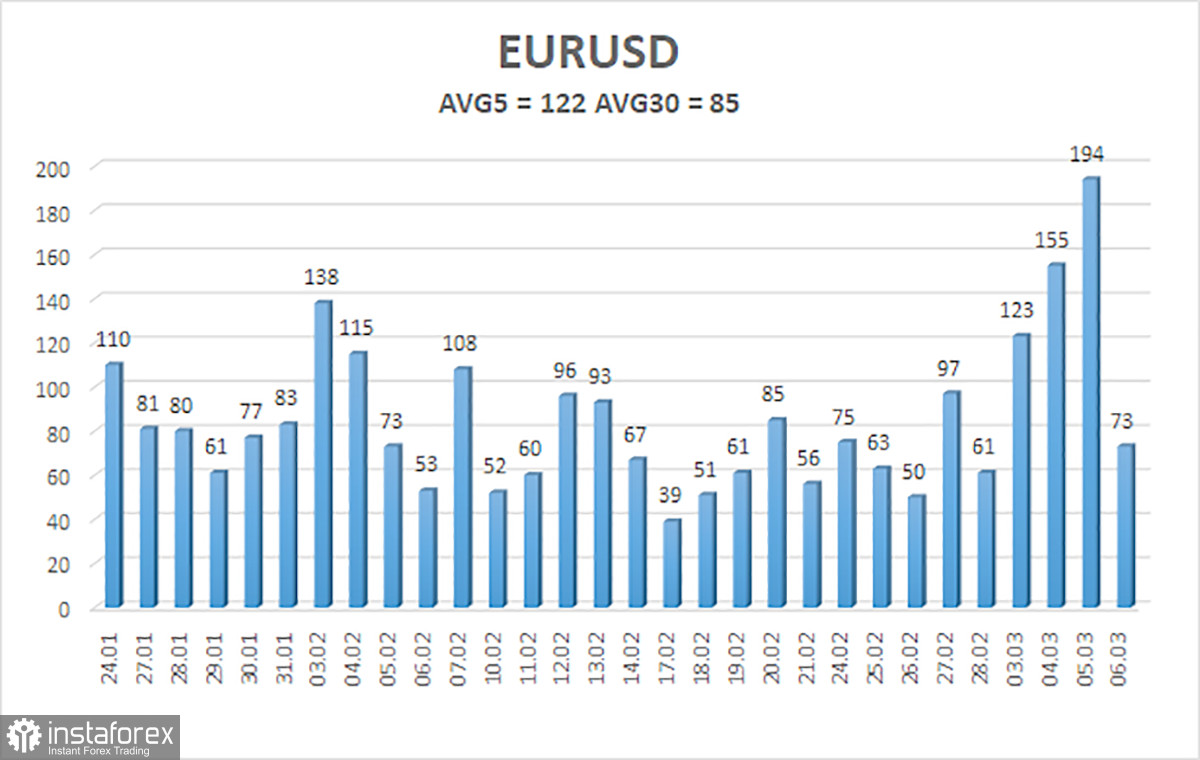
The average volatility of the EUR/USD pair over the last five trading days stands at 122 points, classifying it as high volatility. For Friday, price movements are expected within the 1.0695–1.0939 range. The senior linear regression channel has flattened, and even if it turns upward, the long-term downtrend remains intact. The CCI indicator recently dipped into the oversold zone, signaling another potential upward correction.
Key support levels: S1 – 1.0803 S2 – 1.0742 S3 – 1.0681
Key resistance level: R1 – 1.0864
Trading Strategy Recommendations
EUR/USD has broken out of its previous range and continues to rally. In recent months, the outlook has consistently been bearish for the euro in the medium term, and nothing has changed in that regard. The dollar still has no fundamental reason for a prolonged decline—except for Donald Trump's policies.
Short positions remain more attractive with targets at 1.0315 and 1.0254, but confirmation is needed with a price breakout below the moving average. If you rely purely on technical trading, long positions may be considered above the moving average, targeting 1.0864 and 1.0939. However, any euro strength should still be viewed as a corrective move within the broader downtrend on the daily timeframe.
Explanation of Technical Indicators
- Linear regression channels help determine the prevailing trend. If both channels point in the same direction, the trend is strong.
- The moving average line (20,0, smoothed) defines the short-term trend and trading direction.
- Murray levels serve as potential target zones for price movements and corrections.
- Volatility levels (red lines) indicate the likely trading range for the upcoming session, based on current volatility readings.
- CCI indicator: Readings below -250 signal oversold conditions, while readings above +250 indicate overbought levels, potentially leading to trend reversals.