EUR/USD 5-Minute Analysis
The EUR/USD currency pair continued upward movement throughout Friday, raising some confusion. As we have mentioned multiple times, the key factor is the upward correction on the daily timeframe. Therefore, it is entirely logical that EUR/USD continues to rise. On the hourly timeframe, we have a clear upward trend. However, analyzing all fundamental and macroeconomic data over the past week shows that the euro had fewer reasons to rise than the dollar. This trend has persisted for over a year now.
Nevertheless, the dollar cannot rise indefinitely. Eventually, traders need to lock in profits on dollar positions, and the pair itself must correct. This explains the current price movement, which does not align with recent economic events and reports. The upward correction may continue for quite some time, and on the hourly timeframe, we might see another dozen alternating uptrends and downtrends before the correction is complete.
On Friday, the euro had legitimate reasons to rise. The GDP report in the Eurozone exceeded forecasts, while U.S. retail sales data fell short of expectations. Industrial production in the U.S. increased more than anticipated, but the first two reports still provided upward momentum for the euro.
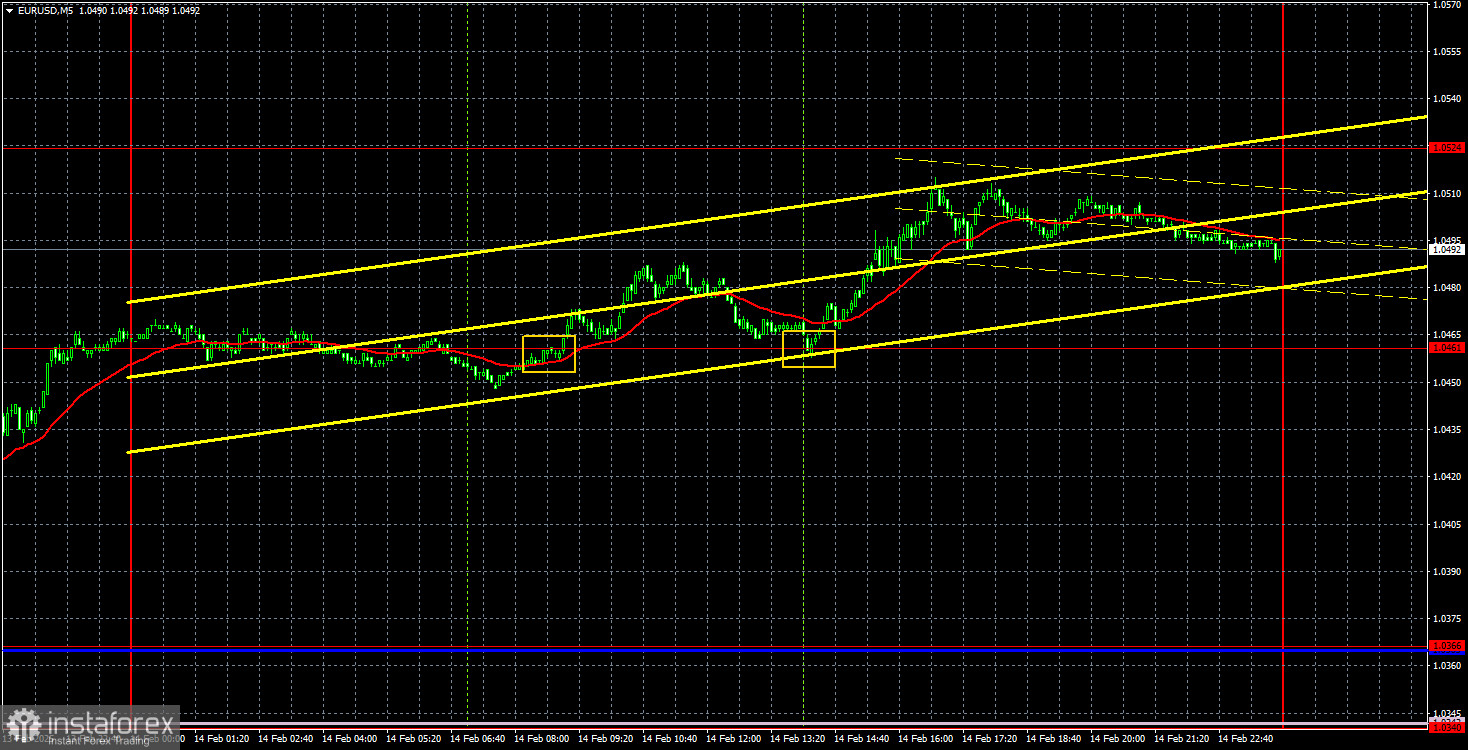
Among the trading signals in the 5-minute timeframe, we can highlight the breakthrough and rebound from the 1.0461 level. These signals overlapped, meaning only one long position should have been opened. By the day's end, the price had increased by approximately 40 pips, which could have been a profitable trade for traders.
COT Report
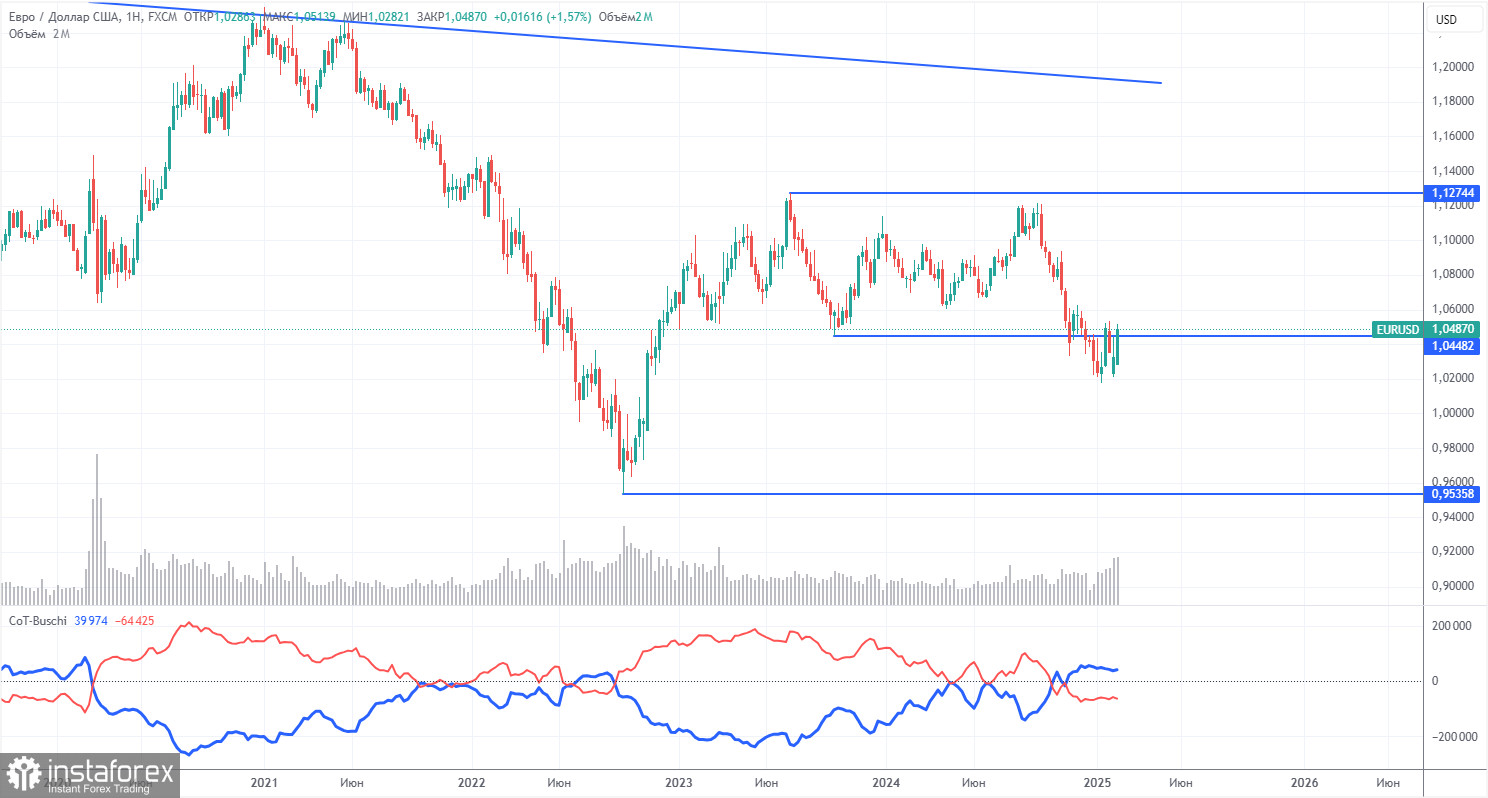
The latest Commitments of Traders (COT) report, dated February 11, reveals that non-commercial traders have maintained a bullish net position for an extended period. However, bears have now taken control. Three months ago, there was a significant increase in short positions among professional traders, resulting in a negative net position for the first time in a long while. This shift indicates that the euro is now being sold more frequently than it is being bought.
Currently, there are no fundamental factors supporting the strength of the euro. The recent upward movement on the weekly timeframe is barely noticeable, suggesting it is merely a technical pullback. The long-standing 16-year downward trend remains intact, even if the pair continues to experience corrections for a few more weeks.
At present, the red and blue lines in the COT report have crossed, indicating a change in their relative positions and signaling a bearish trend in the market. During the last reporting week, long positions among non-commercial traders increased by 3,000, while short positions rose by 8,800, leading to a net position decrease of 5,800.
EUR/USD 1-Hour Analysis
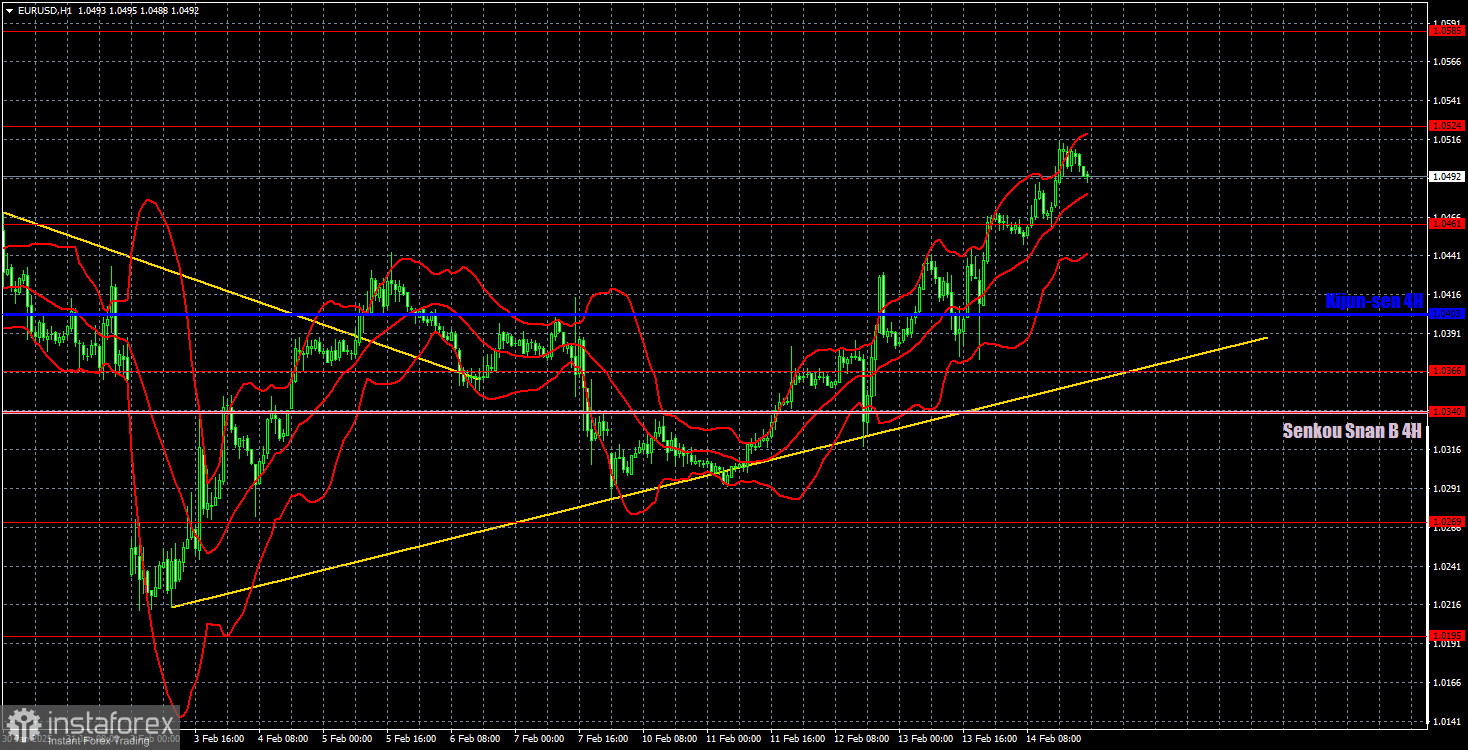
On the hourly timeframe, the pair ended a local downtrend, broke through the descending trendline, and formed a new upward trendline. We still believe that the downtrend will continue in the medium term, as the Fed will likely cut rates only 1-2 times in 2025, a much more hawkish stance than the market had expected. However, we may still see one or two more uptrends in the short term. The euro still lacks strong fundamental support, but the correction on the daily timeframe remains too weak to be considered complete.
For February 17, the following levels are identified for trading: 1.0124, 1.0195, 1.0269, 1.0340-1.0366, 1.0461, 1.0524, 1.0585, 1.0658-1.0669, 1.0757, 1.0797, 1.0843, as well as the Senko Span B line (1.0340) and Kijun-sen line (1.0403). The Ichimoku indicator lines may shift during the day, which should be considered when identifying trading signals. Don't forget to place a Stop Loss at breakeven if the price moves 15 pips in the right direction, which helps protect against potential losses if the signal is false.
On Monday, no significant economic events are scheduled in the Eurozone or the U.S. As a result, volatility may be extremely low, and the euro is unlikely to continue its illogical upward movement.
Illustration Explanations:
- Support and Resistance Levels (thick red lines): Thick red lines indicate where movement may come to an end. Please note that these lines are not sources of trading signals.
- Kijun-sen and Senkou Span B Lines: Ichimoku indicator lines transferred from the 4-hour timeframe to the hourly timeframe. These are strong lines.
- Extreme Levels (thin red lines): Thin red lines where the price has previously bounced. These serve as sources of trading signals.
- Yellow Lines: Trendlines, trend channels, or any other technical patterns.
- Indicator 1 on COT Charts: Represents the net position size for each category of traders.