EUR/USD 5-Minute Analysis
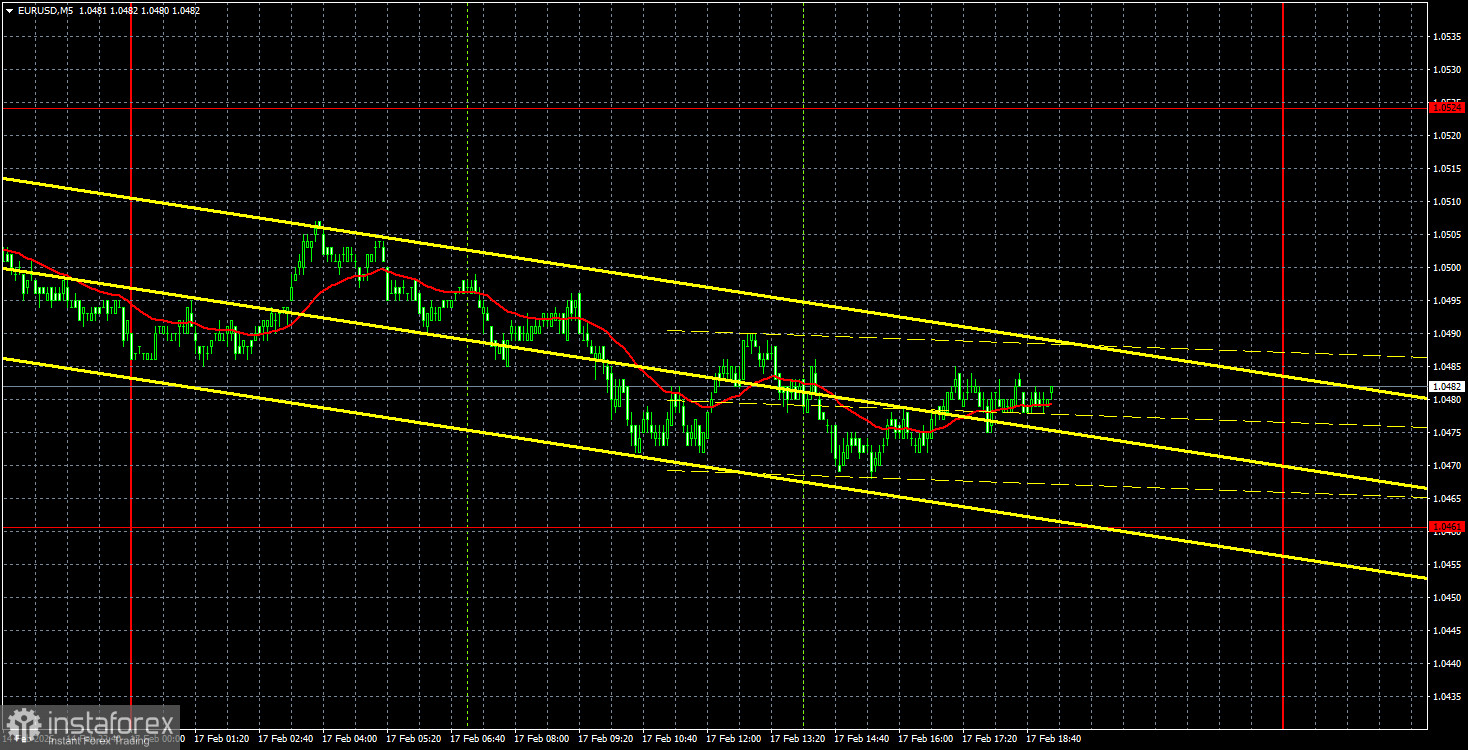
The EUR/USD currency pair demonstrated little interest in trading throughout Monday, with minimal volatility and virtually no price movement. Consequently, there is nothing new to add to previous articles and analyses following the first trading day of the week. The next phase of the upward correction is underway, indicated by the ascending trendline on the hourly timeframe. Overall, the price movement of the euro continues to be part of a correction on the daily chart. In fact, the price action observed in recent weeks appears chaotic, which is typical of corrective movements.
We still believe that the euro lacks a solid fundamental basis for medium-term growth. Monday brought no significant fundamental or macroeconomic updates. There were no major news events, even from Donald Trump, despite his apparent intention to impose tariffs on European imports—though he seems in no rush to act on this decision. Thus, we anticipate a resumption of the downward trend in the medium term, with the pair eventually moving below parity.
On the 5-minute timeframe, no trade signals were generated yesterday. This is not surprising, given that overall volatility did not exceed 40 pips, and the price did not approach any key levels or Ichimoku indicator lines.
COT Report
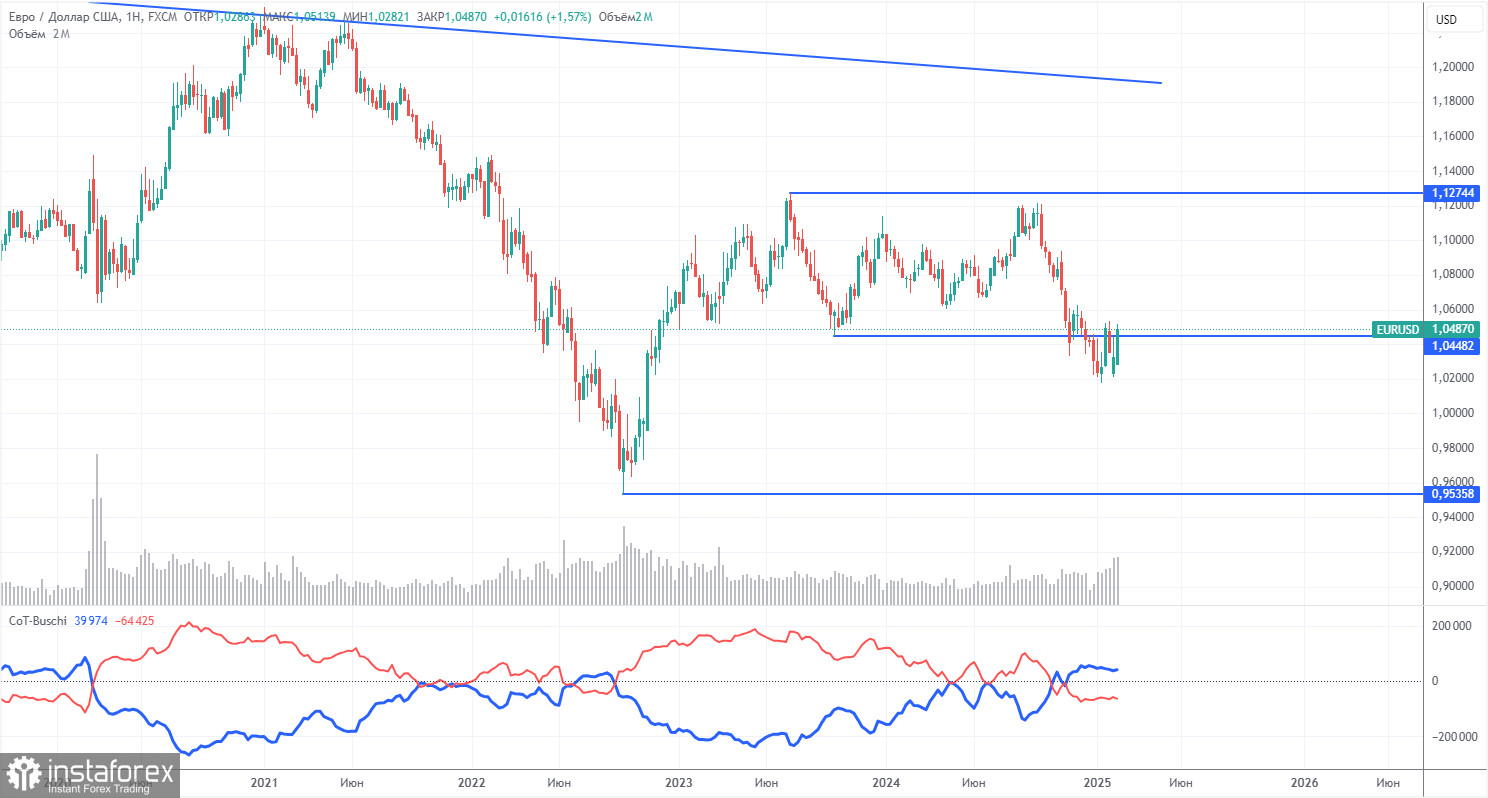
The latest Commitments of Traders (COT) report, dated February 11, reveals that non-commercial traders have maintained a bullish net position for an extended period. However, bears have now taken control. Three months ago, there was a significant increase in short positions among professional traders, resulting in a negative net position for the first time in a long while. This shift indicates that the euro is now being sold more frequently than it is being bought.
Currently, there are no fundamental factors supporting the strength of the euro. The recent upward movement on the weekly timeframe is barely noticeable, suggesting it is merely a technical pullback. The long-standing 16-year downward trend remains intact, even if the pair continues to experience corrections for a few more weeks.
At present, the red and blue lines in the COT report have crossed, indicating a change in their relative positions and signaling a bearish trend in the market. During the last reporting week, long positions among non-commercial traders increased by 3,000, while short positions rose by 8,800, leading to a net position decrease of 5,800.
EUR/USD 1-Hour Analysis
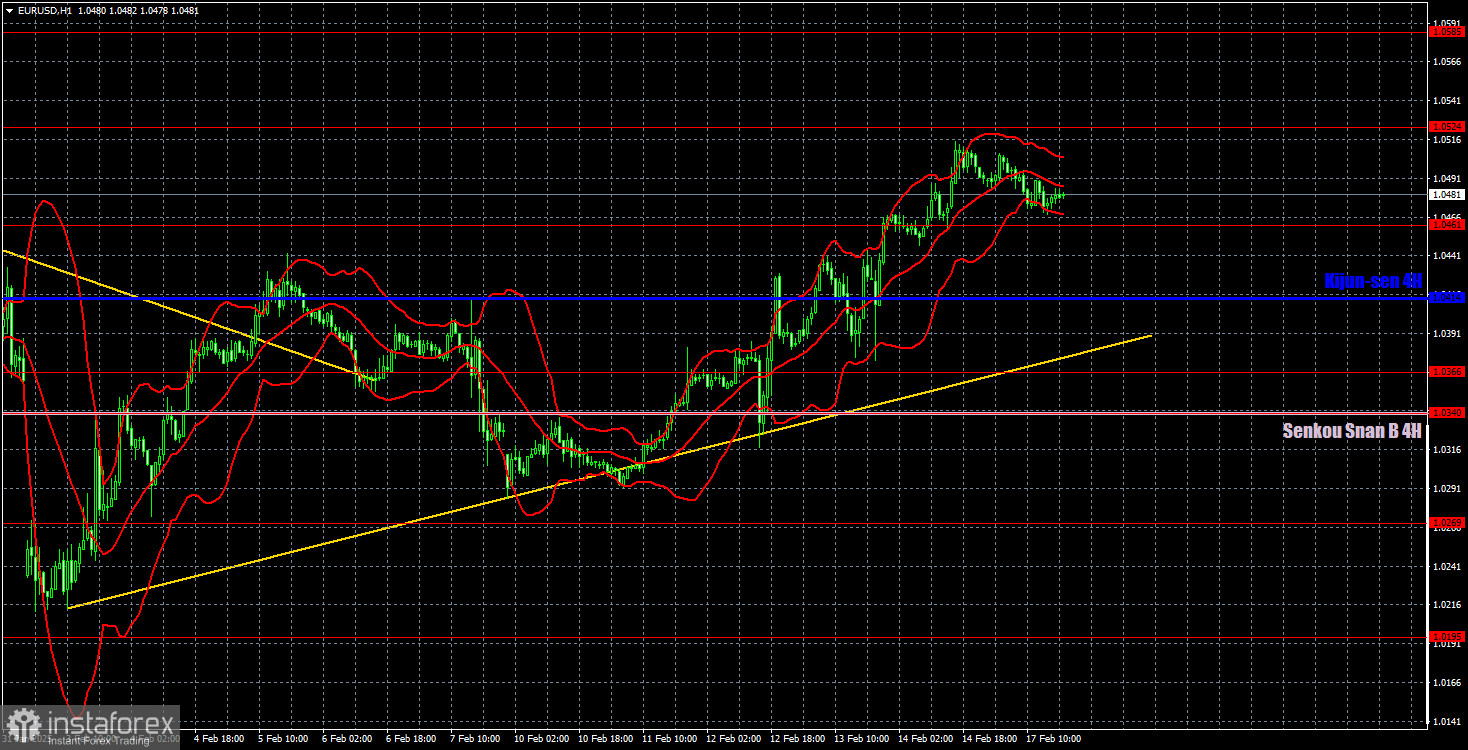
On the hourly time frame, the currency pair is currently developing a new local upward trend. However, we believe that the downtrend will resume in the medium term. This is because the Federal Reserve may only cut rates once or twice in 2025, while the European Central Bank is expected to ease monetary policy much more aggressively. In the short term, we could see one or two additional upward movements, as the correction on the daily time frame may take a considerable amount of time to complete. There are still no fundamental reasons for the euro to rise; its current growth is approximately 80% driven by technical factors.
For February 18, we identify the following trading levels: 1.0124, 1.0195, 1.0269, 1.0340-1.0366, 1.0461, 1.0524, 1.0585, 1.0658-1.0669, 1.0757, 1.0797, and 1.0843. Additionally, the Senkou Span B line is at 1.0340 and the Kijun-sen line is at 1.0414. Note that the Ichimoku indicator lines may shift throughout the day, which should be taken into account when determining trading signals. It is crucial to set a Stop Loss order to breakeven if the price moves 15 pips in the desired direction, to protect against potential losses in case of a false signal.
On Tuesday, there are no significant events scheduled in the Eurozone or the U.S. The ZEW Economic Sentiment indices for Germany and the Eurozone will be published, but their impact on the market is generally limited. As a result, volatility may remain extremely low today, and the euro is unlikely to continue its illogical ascent.
Illustration Explanations:
- Support and Resistance Levels (thick red lines): Thick red lines indicate where movement may come to an end. Please note that these lines are not sources of trading signals.
- Kijun-sen and Senkou Span B Lines: Ichimoku indicator lines transferred from the 4-hour timeframe to the hourly timeframe. These are strong lines.
- Extreme Levels (thin red lines): Thin red lines where the price has previously bounced. These serve as sources of trading signals.
- Yellow Lines: Trendlines, trend channels, or any other technical patterns.
- Indicator 1 on COT Charts: Represents the net position size for each category of traders.