The GBP/USD currency pair experienced a rise on Friday. Sometimes, the market behaves in a way that seems almost unbelievable. Many traders and analysts are accustomed to the idea that price movements are influenced by a wide range of technical, fundamental, and macroeconomic factors, which can be challenging to reconcile. However, at this moment, there is no need to speculate about why the British pound is increasing in value. Last week, there were two significant events that supported the euro's growth, while at least ten events favored the U.S. dollar. As a result, the euro's rally appeared illogical, and a similar conclusion can be drawn regarding the British pound.
The pound would have likely appreciated even without any favorable events. However, there were a few reports that provided additional support for buyers. While these reports did not significantly affect the pound's movements, it still rose by 230 pips, compared to the euro's 190-pip increase. This difference can be attributed to the naturally higher volatility of the pound.
In the UK, the key report last week was the first estimate of Q4 GDP. As we know, the first and third estimates are the most important. UK GDP grew by 0.1% quarter-over-quarter, compared to a forecast of -0.1%. Like in the Eurozone, this is a minimal increase, but the fact that the forecast was exceeded by 0.2% is noteworthy. Additionally, UK industrial production showed an increase of 0.5% versus the expected 0.2%, making this the only extra factor supporting the pound last week. However, as we all understand, this was not a major difference.
Currently, we are observing a continued correction on the daily timeframe, which may persist regardless of fundamental and macroeconomic factors. This correction could end at any moment, as the pound has retraced enough to potentially resume its downtrend. However, corrections generally last longer and tend to be complex. It wouldn't be surprising if GBP/USD falls by 200 pips over the next two weeks, only to rise again by 250 pips—this is all part of the position accumulation process by major market players.
There are still no long-term reasons for the sterling to appreciate. The Bank of England's policy remains much more dovish compared to that of the Federal Reserve. Despite a "significant" growth of just 0.1% in the UK economy in Q4, the U.S. economy experienced a "disastrous result" for the same quarter, yet grew by 2.3%. Perhaps there will be changes in the fundamental landscape, or maybe Donald Trump will introduce policies that drive investors away from the U.S. But for now, there is no basis for expecting such a scenario.
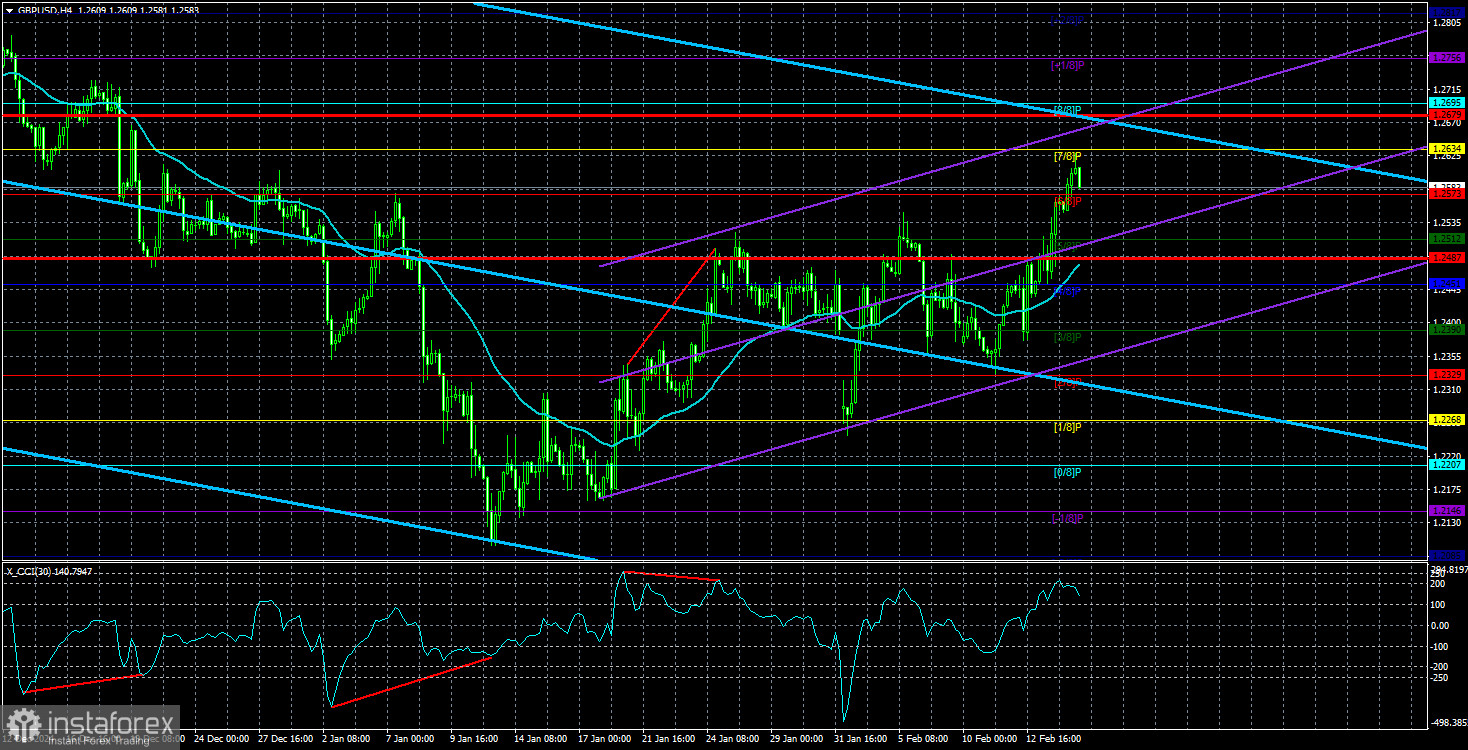
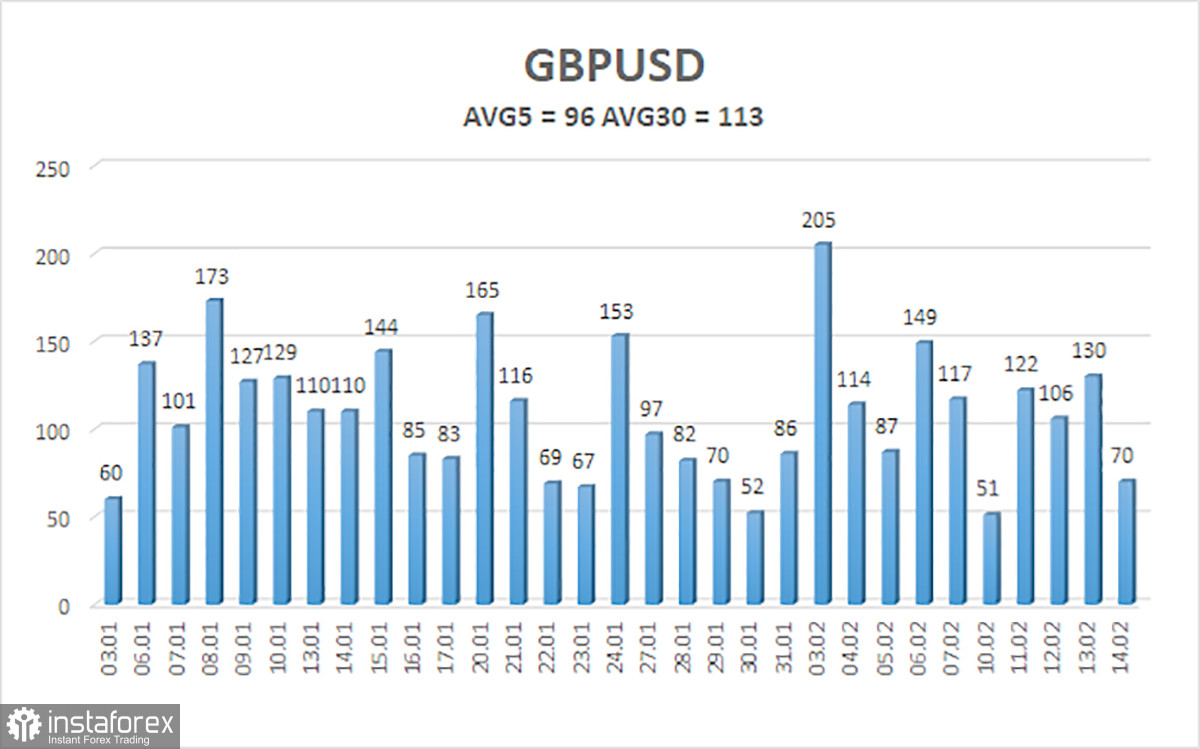
The average volatility of the GBP/USD pair over the last five trading days is 96 pips, considered "moderate" for this pair. On Monday, February 17, we expect the pair to trade within the range of 1.2487–1.2679. The long-term regression channel remains downward, indicating a continuing bearish trend. The CCI indicator recently entered the oversold zone, signaling a new wave of bullish correction.
Nearest Support Levels:
S1 – 1.2573
S2 – 1.2512
S3 – 1.2451
Nearest Resistance Levels:
R1 – 1.2634
R2 – 1.2695
R3 – 1.2756
Trading Recommendations:
The GBP/USD pair maintains a medium-term downtrend. We still do not consider long positions, as we believe all bullish factors for sterling have already been priced in multiple times, and no new ones have emerged. For traders using pure technical analysis, long positions are possible with targets at 1.2634 and 1.2679, provided the price remains above the moving average.
Short positions remain more relevant, with initial targets at 1.2207 and 1.2146, since sooner or later, the correction on the daily timeframe will end. At the very least, price consolidation below the moving average is required for short positions. The ideal short entry would be at the end of the ongoing correction on the daily timeframe, but this could last for an extended period.
Explanation of Illustrations:
Linear Regression Channels help determine the current trend. If both channels are aligned, it indicates a strong trend.
Moving Average Line (settings: 20,0, smoothed) defines the short-term trend and guides the trading direction.
Murray Levels act as target levels for movements and corrections.
Volatility Levels (red lines) represent the likely price range for the pair over the next 24 hours based on current volatility readings.
CCI Indicator: If it enters the oversold region (below -250) or overbought region (above +250), it signals an impending trend reversal in the opposite direction.