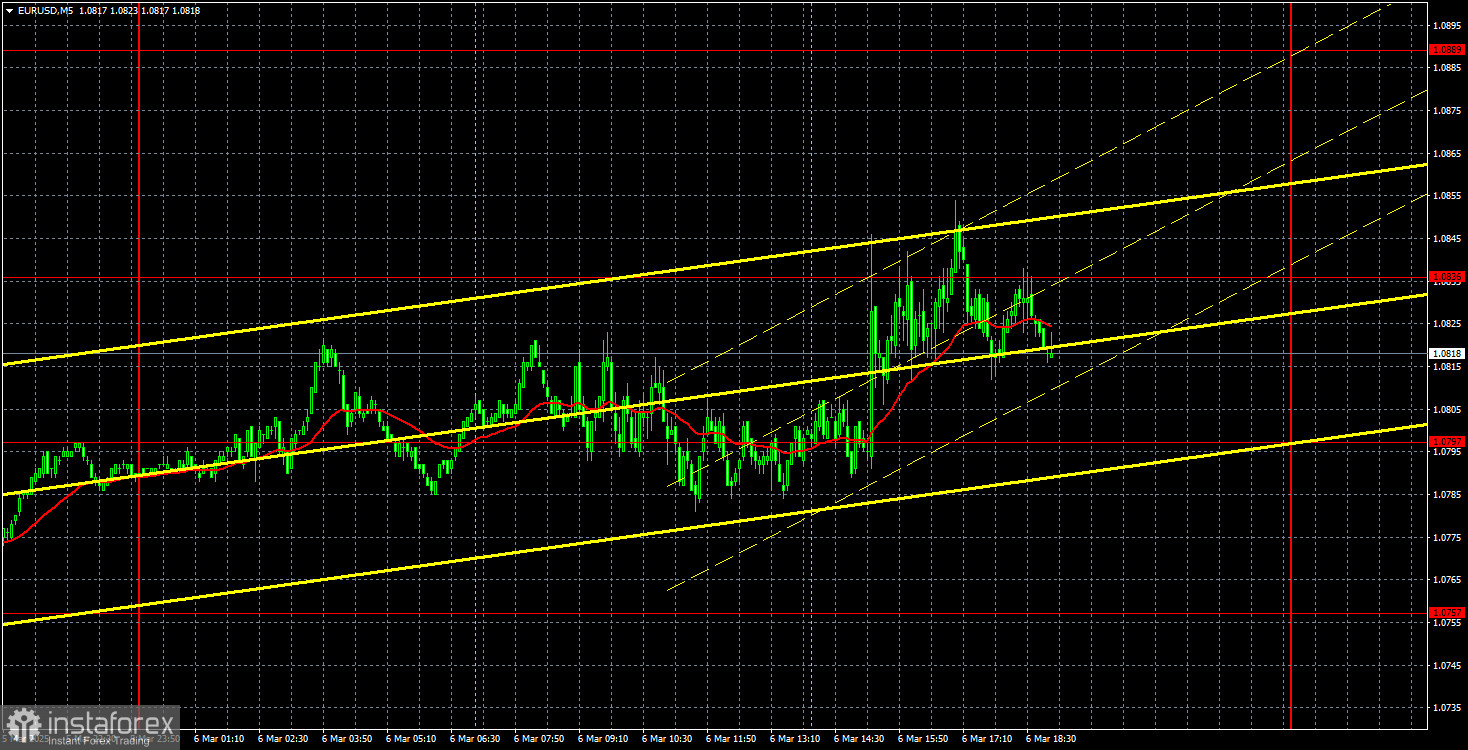
EUR/USD 5M Analysis
Throughout Thursday, the EUR/USD pair maintained its bullish trend. However, the pace of growth was slower compared to the first three days of the week. By now, the U.S. dollar has already lost 400 points, with no strong macroeconomic justification for such a decline. Thursday's session further reinforced this point.
The ECB meeting resulted in a decision to cut all three key interest rates. How did the euro react? It rose slightly, but the more accurate description would be that the U.S. dollar fell further. The American currency continues its decline due to decisions and statements from President Donald Trump, a trend that has become apparent to every trader. Given this environment, analyzing macroeconomic data has become nearly irrelevant.
What remains interesting is today's U.S. labor market and unemployment reports. If the data turns out weaker than expected, the dollar could extend its losses.
Markets are also wary of a potential shift in Jerome Powell's rhetoric toward a more dovish stance, as he is scheduled to speak later today. The week has been intense, dominated by Trump's policies, and Friday's session is unlikely to be any different.
There were no clear trading signals for the euro over the past three days, as the pair ignored key levels and simply surged higher. On Thursday, despite conditions favoring a pullback, the market remained stagnant. Levels around 1.0797 and 1.0836 provided some trading opportunities, but price action was highly inconsistent.
COT Report Analysis
The most recent Commitments of Traders (COT) report, dated February 25, shows that non-commercial traders' net position has shifted into bearish territory. Three months ago, professional traders sharply increased their short positions, pushing the net position negative for the first time in a long while. This suggests that the euro is now being sold more frequently than it is bought, reinforcing a bearish market sentiment.
From a fundamental perspective, there is no clear justification for sustained euro strength. While recent gains on the weekly timeframe remain barely noticeable, they still appear to be a standard correction rather than a trend reversal. Even if the pair corrects for several weeks or months, this does not alter the 16-year-long downtrend.
At present, the red and blue lines in the COT report have crossed, signaling a bearish shift in the market. Over the last reporting week, long positions increased by 12,400 contracts, while short positions decreased by 13,600 contracts. This resulted in a net increase of 26,000 contracts, although it has yet to significantly influence the overall market outlook.
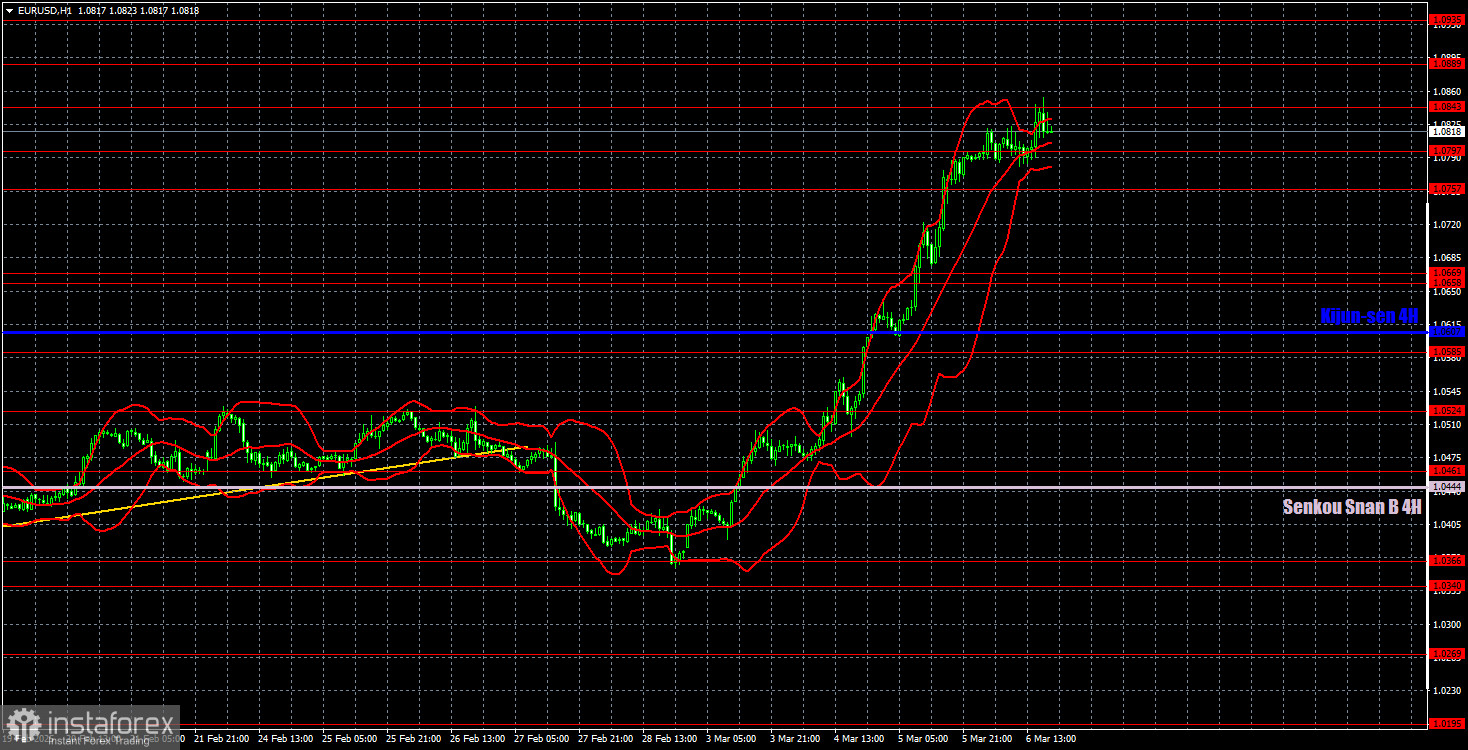
EUR/USD 1H Analysis
On the hourly timeframe, EUR/USD remains in an aggressive uptrend. In the medium term, we anticipate a resumption of the downtrend due to monetary policy divergence between the ECB and the Federal Reserve. However, the current movement appears driven by panic selling of the dollar, making it difficult to predict its immediate trajectory. Traders are ignoring all fundamentals except Trump's statements, leading to near-vertical price action.
For March 7, key trading levels include 1.0269, 1.0340–1.0366, 1.0461, 1.0524, 1.0585, 1.0658–1.0669, 1.0757, 1.0797, 1.0843, 1.0889, and 1.0935, along with the Senkou Span B line (1.0444) and the Kijun-sen line (1.0607). As Ichimoku indicator lines may shift intraday, traders should factor in their movements when assessing trading signals.
Setting Stop Loss orders at breakeven after a 15-point move in the right direction is advisable to protect against potential losses if a signal turns out to be false.
Key Events to Watch on March 7
Friday brings several high-impact events, including:
- U.S. NonFarm Payrolls (NFP) and unemployment rate reports
- Jerome Powell's speech
- Christine Lagarde's speech
- Final Q4 GDP data for the Eurozone
With such an event-packed calendar, volatility is expected to remain elevated, though it remains uncertain how much the market will react to these releases.
Explanation of Key Chart Elements
- Support and resistance levels (bold red lines): Areas where price movement may slow or reverse. These are not direct trading signals.
- Kijun-sen and Senkou Span B: Ichimoku indicator lines taken from the 4-hour timeframe, serving as strong support/resistance levels.
- Extreme levels (thin red lines): Price levels where significant reversals have previously occurred, serving as potential trading signals.
- Yellow lines: Trendlines, trend channels, and other technical patterns.
- COT Report Indicator: Displays the net position of different trader categories.