EUR/USD
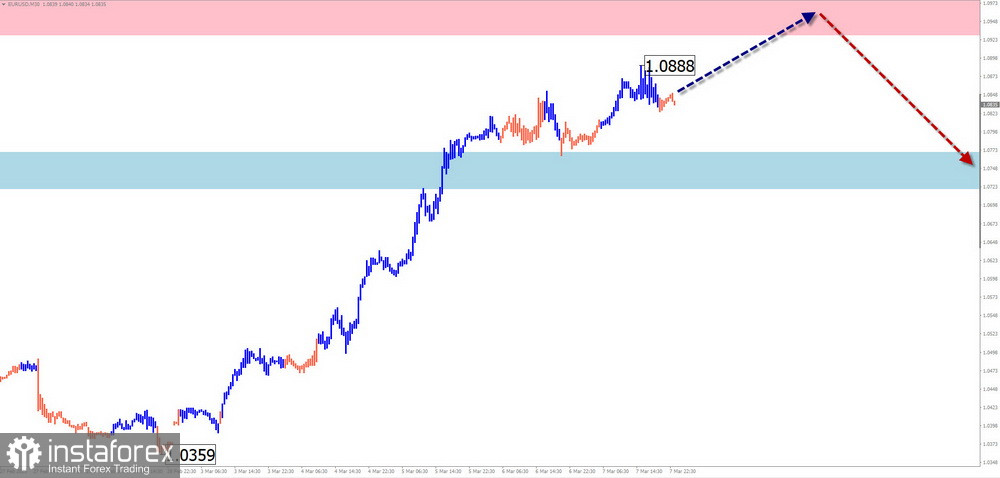
Analysis:Since early February, the euro has been forming an upward zigzag wave, marking the beginning of a new bullish trend. The pair has reached a significant potential reversal zone on the weekly timeframe, and the current wave structure appears complete.
Forecast:A moderate upward movement is expected in the first half of the upcoming week, with the euro rising toward the lower boundary of resistance. After that, a reversal is likely, leading to a price decline toward the support zone.
Potential Reversal Zones:
- Resistance: 1.0930–1.0980
- Support: 1.0770–1.0720
Trading Recommendations:
- Buying: Possible with reduced volume sizes within separate trading sessions.
- Selling: Preferred from the resistance zone after confirmation of reversal signals.
USD/JPY
Analysis:A downward wave has been forming in USD/JPY since December. The price has now reached the lower boundary of a major resistance zone on the weekly timeframe. The wave structure appears complete, and the bullish movement that started on March 6th shows potential for further upward correction.
Forecast:A sideways movement is expected throughout the week, with price action fluctuating near the lower boundary of the reversal zone. Toward the end of the week, the probability of a bullish reversal increases. A brief break below support is possible before the reversal occurs.
Potential Reversal Zones:
- Resistance: 150.50–151.00
- Support: 147.50–147.00
Trading Recommendations:
- Selling: Not advisable due to weak potential and increased risk.
- Buying: Only recommended if confirmed reversal signals appear in the support area.
GBP/JPY
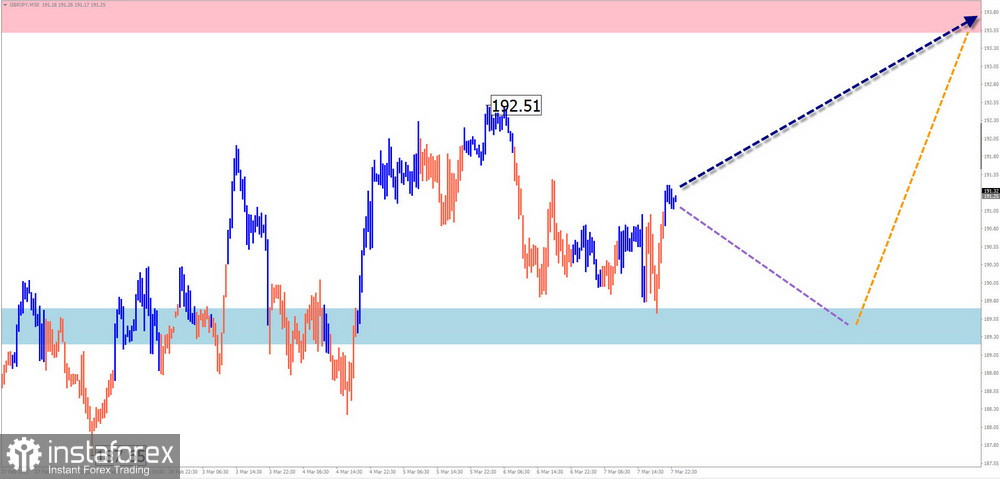
Analysis:The GBP/JPY pair has been forming a downward wave since February 13th, moving within a contracting price pattern. The pair is currently drifting along the lower boundary of a potential reversal zone on the daily timeframe.
Forecast:A sideways movement is more likely at the beginning of the week. In the support area, a reversal formation is expected, with an increased probability of price growth by the end of the week.
Potential Reversal Zones:
- Resistance: 193.50–193.00
- Support: 189.70–189.20
Trading Recommendations:
- Selling: High risk and low potential.
- Buying: Recommended only after confirmed reversal signals in the support zone.
USD/CAD
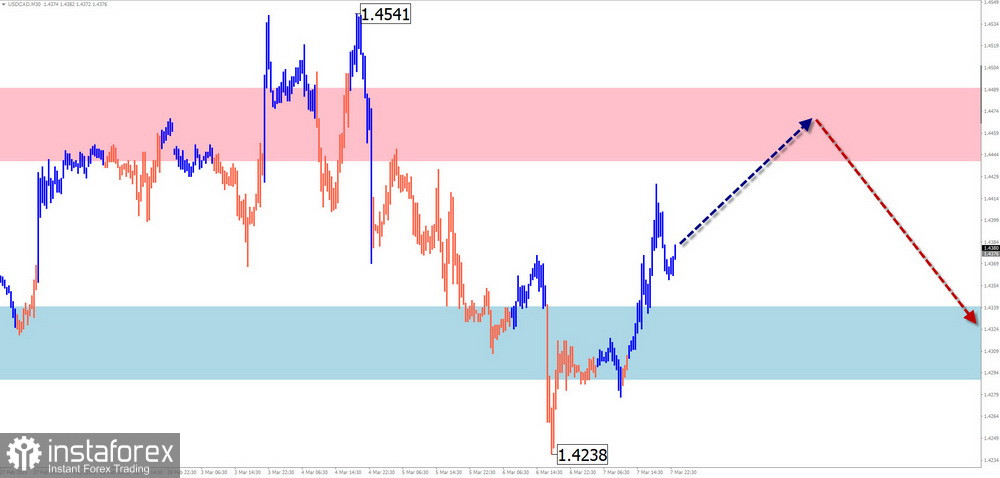
Analysis:Since February, USD/CAD has been forming a downward wave, with the ongoing correction developing as a contracting flat pattern. The pair is currently near the upper boundary of its price corridor.
Forecast:A sideways movement is expected in the coming days, followed by a bearish reversal and price decline. The downward trend may resume after the current consolidation phase ends.
Potential Reversal Zones:
- Resistance: 1.4440–1.4490
- Support: 1.4240–1.4190
Trading Recommendations:
- Selling: Risky before clear reversal signals appear in the resistance area.
- Buying: Suitable for intraday trading with small volume sizes but limited potential.
Gold (XAU/USD)
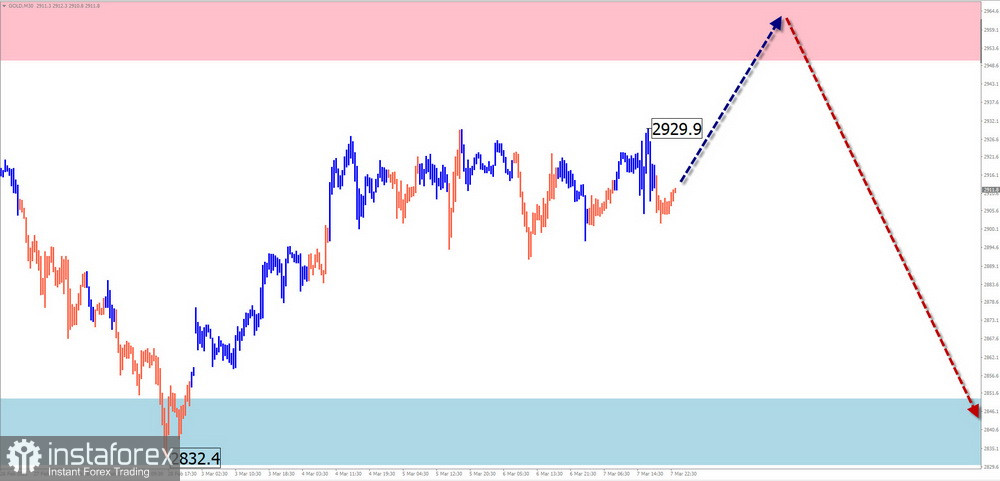
Analysis:Gold is trading near historical highs, moving within a narrow sideways range for the past month. The current wave segment is an upward correction, which appears close to completion.
Forecast:In the coming days, the price may attempt to break the upper boundary of the resistance zone. A brief breakout is possible, followed by a sharp reversal and renewed decline. The upper boundary of a major reversal zone on the weekly timeframe lies in the support area.
Potential Reversal Zones:
- Resistance: 2950.0–2970.0
- Support: 2850.0–2830.0
Trading Recommendations:
- Buying: High risk with limited profit potential.
- Selling: Recommended only after confirmed reversal signals in the resistance zone.
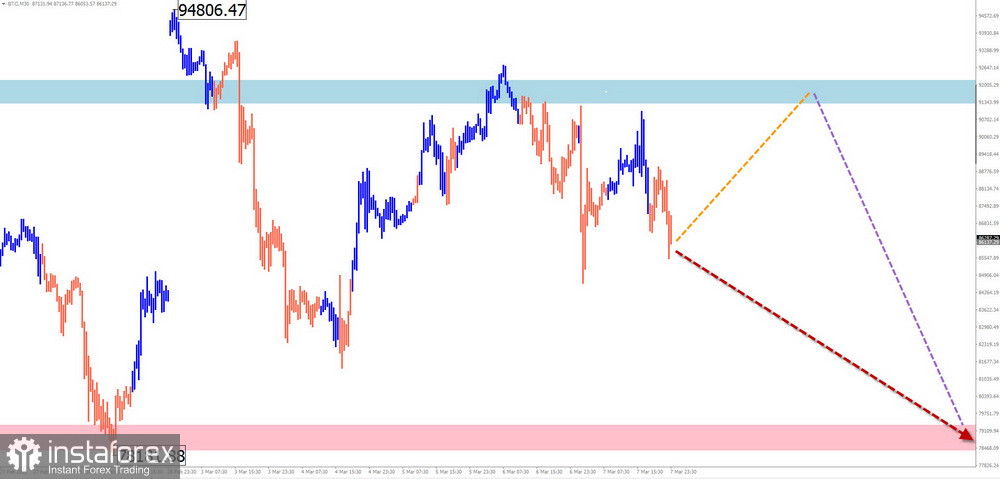
Bitcoin (BTC/USD)
Analysis: A downward wave has been forming in Bitcoin since December, with the final segment (C) developing since March 3rd. A correction is currently unfolding within this wave as a contracting flat pattern, which remains incomplete.
Forecast: A sideways trend is expected in the coming days, with a gradual rise toward the calculated resistance level. A reversal is anticipated afterward, with a possible brief break above resistance before declining. Increased volatility is expected toward the end of the week, likely aligning with the release of key economic data.
Potential Reversal Zones:
- Resistance: 91,300–92,300
- Support: 79,300–78,300
Trading Recommendations:
- Buying: High risk and low potential.
- Selling: More promising, but requires confirmation of reversal signals in the resistance zone.
Explanations of the Simplified Wave Analysis (SWA):
In SWA, all waves consist of three segments (A-B-C). The analysis focuses on the last incomplete wave on each timeframe. The dotted lines indicate expected movements.
Important Notice:The wave algorithm does not account for the time duration of price movements. Therefore, while directional predictions hold, the timing of price reversals may vary.