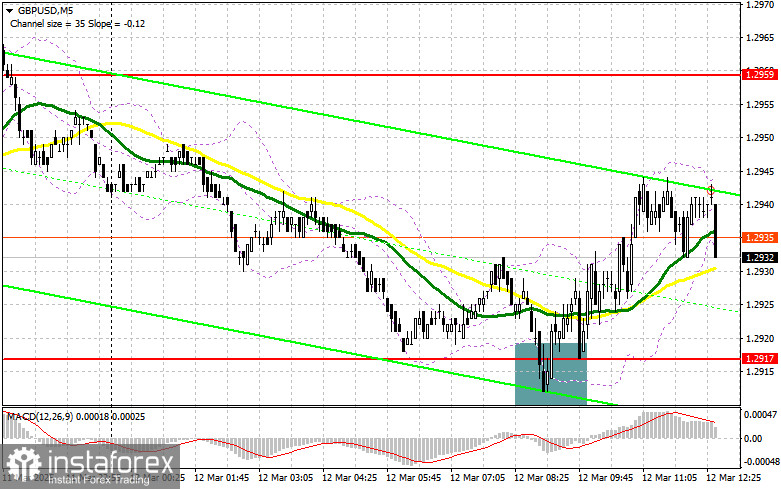
In my morning forecast, I highlighted the 1.2917 level and planned to base my market entry decisions on it. Let's look at the 5-minute chart and analyze what happened. A decline and the formation of a false breakout around 1.2917 led to a buying opportunity for the pound, resulting in a 30-point rise. The technical outlook for the second half of the day remains unchanged.
To Open Long Positions on GBP/USD:
Pound buyers remained active, and the continued absence of UK economic data helped them defend the nearest support level at 1.2917. In the second half of the day, we expect US consumer price index data, including core CPI excluding food and energy for February. Only news of slowing price pressure in the US will support further pound growth; otherwise, I anticipate a market correction. For this reason, I will consider buying only after a decline and a false breakout formation around the same support at 1.2917. This will provide a good entry point for long positions with the target of recovering to the 1.2959 resistance, which was not tested in the first half of the day. A breakout and retest from top to bottom of this range will create another buying opportunity, with the prospect of updating 1.3006, restoring the bullish market. The furthest target will be the 1.3040 area, where I plan to take profits. If GBP/USD declines and there is no buyer activity at 1.2917 in the second half of the day, pressure on the pound will increase, potentially leading to a significant drop. In this case, only a false breakout around the 1.2876 low will be a suitable condition for opening long positions. I plan to buy GBP/USD on a rebound from the 1.2841 support, targeting a 30-35 point correction within the day.
To Open Short Positions on GBP/USD:
Sellers made an attempt but failed to break below the nearest support level. Only US inflation data could exert significant pressure on the pair, so be prepared for that. In the second half of the day, attention will shift to defending the 1.2959 resistance, and only a false breakout at this level will provide a good selling opportunity, aiming for a decline toward 1.2917—the middle of the sideways channel. A breakout and a retest from below of this range will trigger stop-loss orders, opening the way to 1.2876. The furthest target will be the 1.2841 level, where I plan to take profits. Testing this level may halt further bullish market development. If demand for the pound persists in the second half of the day and bears do not show activity around 1.2959, where the moving averages are located, it would be better to postpone sales until testing the 1.3006 resistance. I will open short positions there only after a failed consolidation. If there is no downward movement at that level, I will look for short positions on a rebound around 1.3040, but only for a 30-35 point correction within the day.
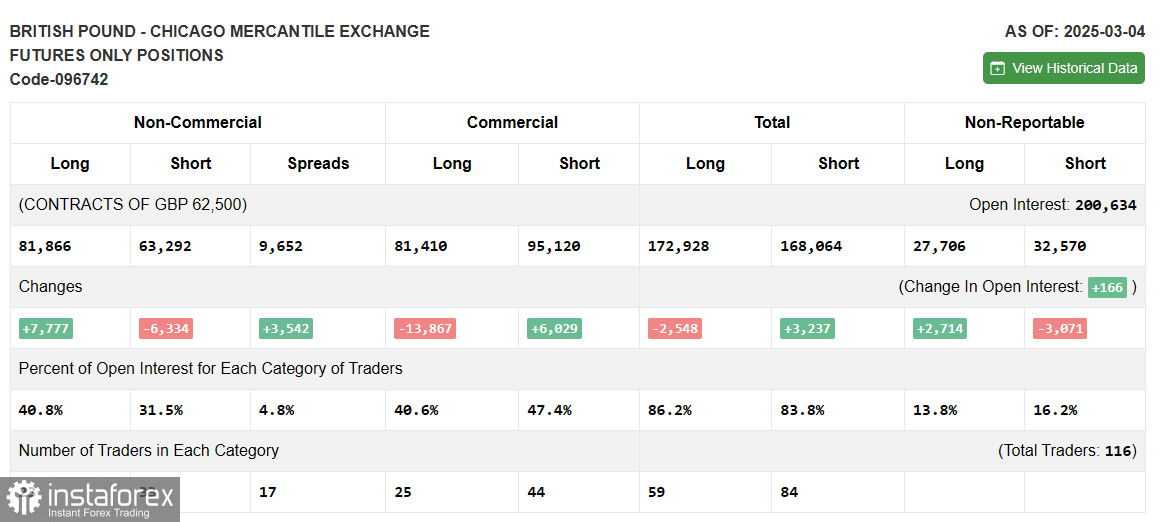
The Commitment of Traders (COT) report for March 4 showed a minimal increase in long positions and a reduction in short positions. The advantage of buyers is becoming more evident, allowing for further GBP/USD growth. Considering the positive economic trends in the UK and the Bank of England's gradual approach to interest rate cuts, it is possible that GBP/USD will continue its upward movement. However, market corrections remain a risk on the way to updating local highs. The latest COT report indicated that non-commercial long positions increased by 7,777 to 81,866, while non-commercial short positions decreased by 6,334 to 63,292. As a result, the gap between long and short positions increased by 3,542.
Indicator Signals:
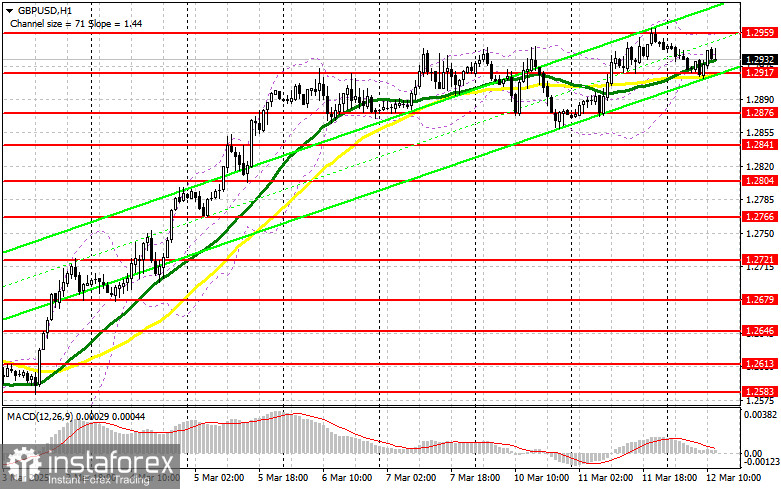
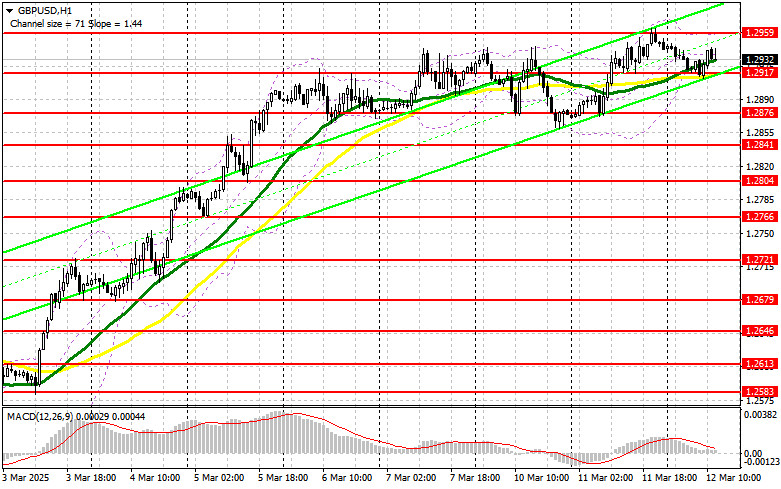
Moving Averages: Trading is above the 30-day and 50-day moving averages, indicating further growth potential.
Bollinger Bands: If the pair declines, the lower boundary of the indicator around 1.2917 will act as support.
Indicator Descriptions: • Moving Average (MA) – identifies the current trend by smoothing volatility and noise. Period: 50 (yellow line on the chart). • Moving Average (MA) – identifies the current trend by smoothing volatility and noise. Period: 30 (green line on the chart). • MACD Indicator (Moving Average Convergence/Divergence) – Fast EMA: 12-period, Slow EMA: 26-period, SMA: 9-period. • Bollinger Bands – Period: 20. • Non-commercial traders – speculators such as individual traders, hedge funds, and large institutions using the futures market for speculative purposes. • Non-commercial long positions – the total long open position of non-commercial traders. • Non-commercial short positions – the total short open position of non-commercial traders. • Total non-commercial net position – the difference between short and long positions of non-commercial traders.