On Tuesday, the GBP/USD currency pair gained another 80 pips, following a 120-pip increase the day before. In just two days, the U.S. dollar has weakened by nearly 200 pips, despite the macroeconomic conditions not favoring the British currency. In the case of the euro, there was at least the inflation report, which could hypothetically reduce the European Central Bank's willingness to ease monetary policy at every meeting. So, what caused the significant increase in the British pound?
Was it the second estimate of the UK's manufacturing PMI? Or perhaps the U.S. ISM Manufacturing PMI, which was only 0.2 points below expectations? It could also be attributed to an empty economic calendar on Tuesday.
In our view, the answer is clear: the sharp drop in the U.S. dollar is linked to Donald Trump. We are neither supporters nor opponents of the American president; we are simply observing the evident reasons for the market's reaction. Over the weekend, we noted the potential for a "storm" on Monday due to extraordinary events occurring in the Oval Office. Never before in U.S. history has an international dispute between leaders played out live from the White House. While we weren't certain the dollar would fall on Monday, the market ultimately made its position clear.
However, Trump didn't stop there. Late Tuesday night, he announced sanctions on Mexico and Canada at a rate of 25% and doubled tariffs on imports from China. While such news triggered dollar buying in the past, the market has now spent two days frantically selling off the U.S. currency. Whether this is good or bad for the U.S. economy remains to be seen. A weaker dollar typically benefits an export-heavy economy so that the U.S. economy might gain from this shift in the long run. However, there is now little doubt that inflation will rise again globally. How will central banks respond to this new world order?
Remember that Trump has only been in power for a month and a half, yet global markets are already in turmoil. His series of shocking decisions is unlikely to end here. The British pound's growth can still be considered a correction on the daily timeframe. It is strong but has yet to exceed 50% of the previous decline. In this sense, nothing catastrophic has happened, and the six-month and 16-year downward trends remain intact. However, if the market continues to flee the dollar in response to Trump's decisions, both trends could soon end. 2025 is likely another year of turmoil—political, trade, and geopolitical. The world is on the verge of major global shifts, and we hope they will be positive.
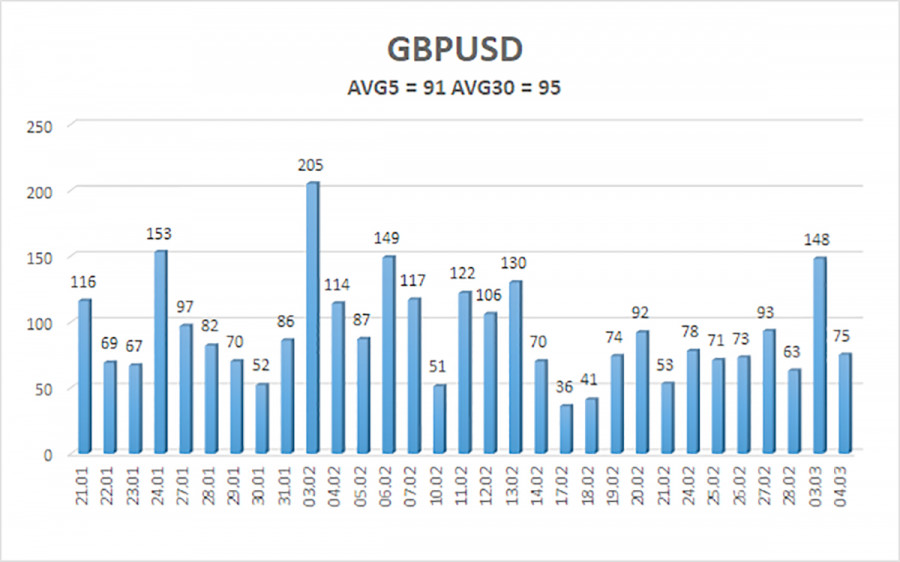
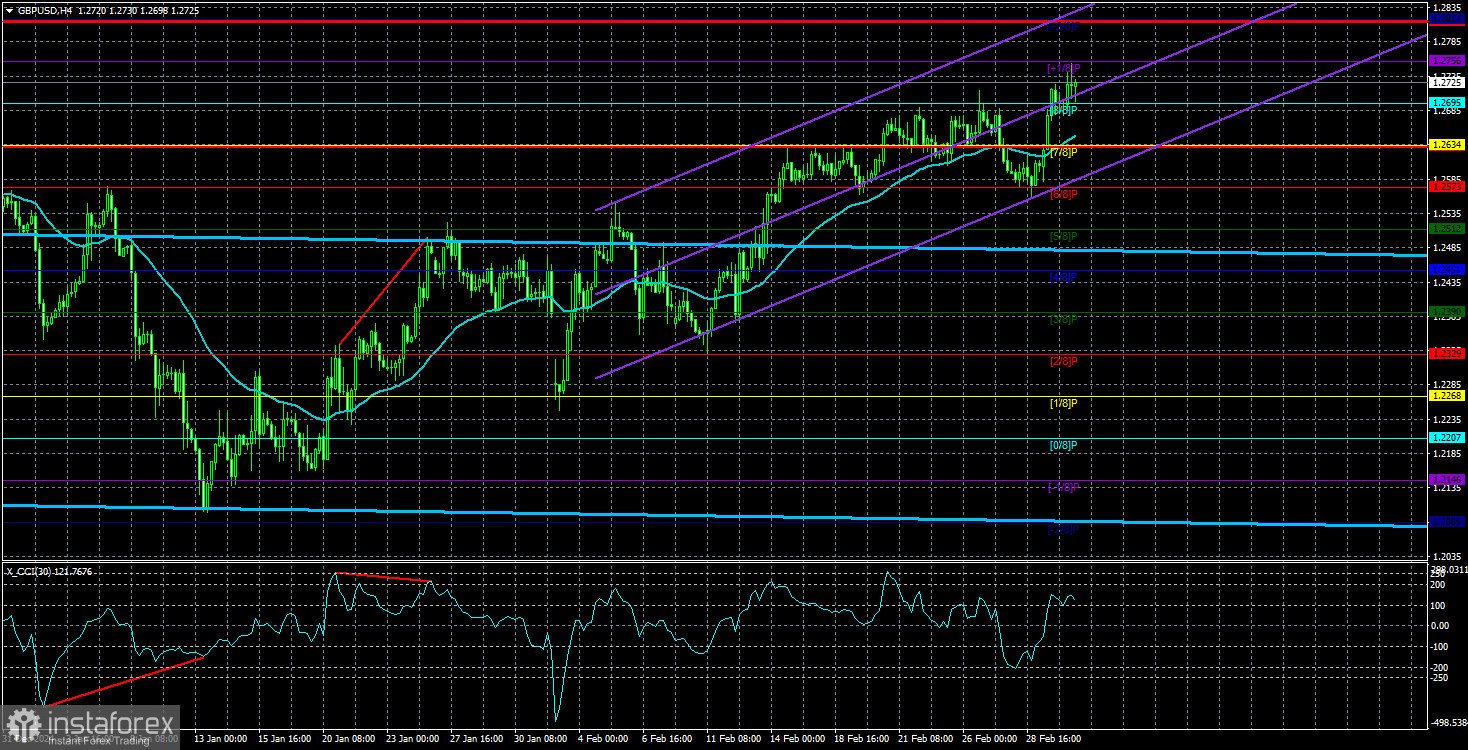
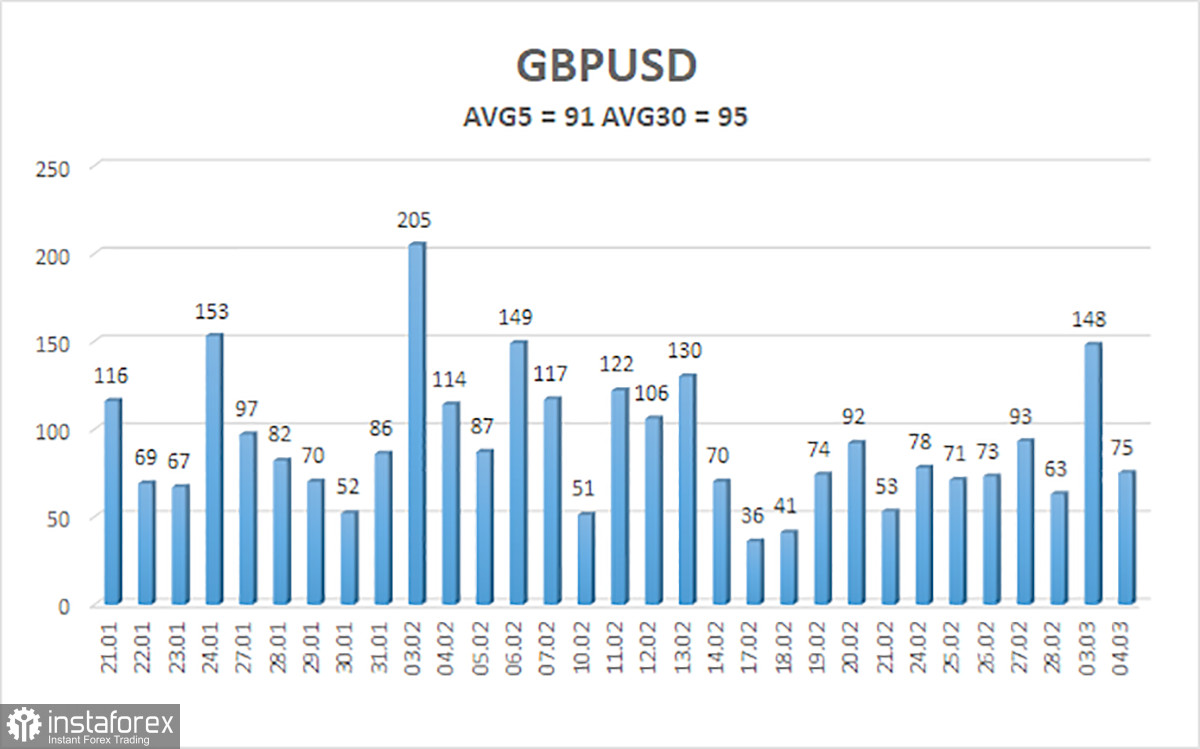
The average volatility of the GBP/USD pair over the past five trading days is 91 pips, which is considered "moderate" for this currency pair. On Wednesday, March 5, we expect movement within the range of 1.2633 to 1.2815. The long-term regression channel has turned sideways, but the downward trend remains visible on the daily timeframe. The CCI indicator entered the overbought zone, signaling a possible decline, but the correction so far has been weak.
Nearest Support Levels:
S1 – 1.2695
S2 – 1.2634
S3 – 1.2573
Nearest Resistance Levels:
R1 – 1.2756
R2 – 1.2817
Trading Recommendations:
The GBP/USD currency pair maintains a medium-term downward trend. We still do not consider long positions, as we believe the current upward movement is merely a correction. If you trade purely on technical analysis, long positions are possible, with targets at 1.2756 and 1.2817 if the price remains above the moving average. However, short positions remain much more relevant, with targets at 1.2207 and 1.2146, as the upward correction on the daily timeframe will eventually end. A confirmed break below the moving average is needed for further confirmation. The British pound currently appears overbought.
Explanation of Illustrations:
Linear Regression Channels help determine the current trend. If both channels are aligned, it indicates a strong trend.
Moving Average Line (settings: 20,0, smoothed) defines the short-term trend and guides the trading direction.
Murray Levels act as target levels for movements and corrections.
Volatility Levels (red lines) represent the likely price range for the pair over the next 24 hours based on current volatility readings.
CCI Indicator: If it enters the oversold region (below -250) or overbought region (above +250), it signals an impending trend reversal in the opposite direction.