The GBP/USD currency pair stalled on Thursday. Before the start of the U.S. trading session, the pound even pulled back slightly, though this retracement had little impact. The British pound has been rising for almost two months straight, gaining 800 points in that time. Initially, this movement seemed logical as it followed a sharp decline and required a correction, but now the pound appears excessively overbought.
The market is clearly worried about a stable U.S. economy that has shown resilience even during periods of high Federal Reserve interest rates but now faces the risk of recession. If the U.S. alienates half the world, how will that impact its economy? The answer seems obvious. As a result, even the British pound, whose economy has barely grown in two years, is now perceived as more attractive than the U.S. dollar. While the UK economy has been stagnant, the U.S. could be heading for a prolonged downturn. The Fed, which had planned only two rate cuts this year, might have to ease policy more aggressively due to recession risks. This is still speculative, as no official statements from Federal Reserve officials have confirmed such plans. However, the market already senses where things are headed.
Today, the U.S. labor market and unemployment reports will be released. If they are weaker than expected, there is little doubt—the dollar will plummet again. If the data comes in stronger, the dollar may rise, but what kind of rebound would that be? A 50-point gain after dropping 350 points this week alone?
The current market situation is complicated by the fact that trading is driven by emotions and a single factor while ignoring all others. How can we tell if the market has fully priced in its concerns about the future of the U.S.? If it has, then the dollar should start appreciating. If today's U.S. reports disappoint but the dollar still strengthens, it would suggest that the market has reached a turning point. Right now, price action is highly unpredictable. The dollar can decline even on favorable data, as seen on Wednesday, or rally when there seems to be no reason for it.
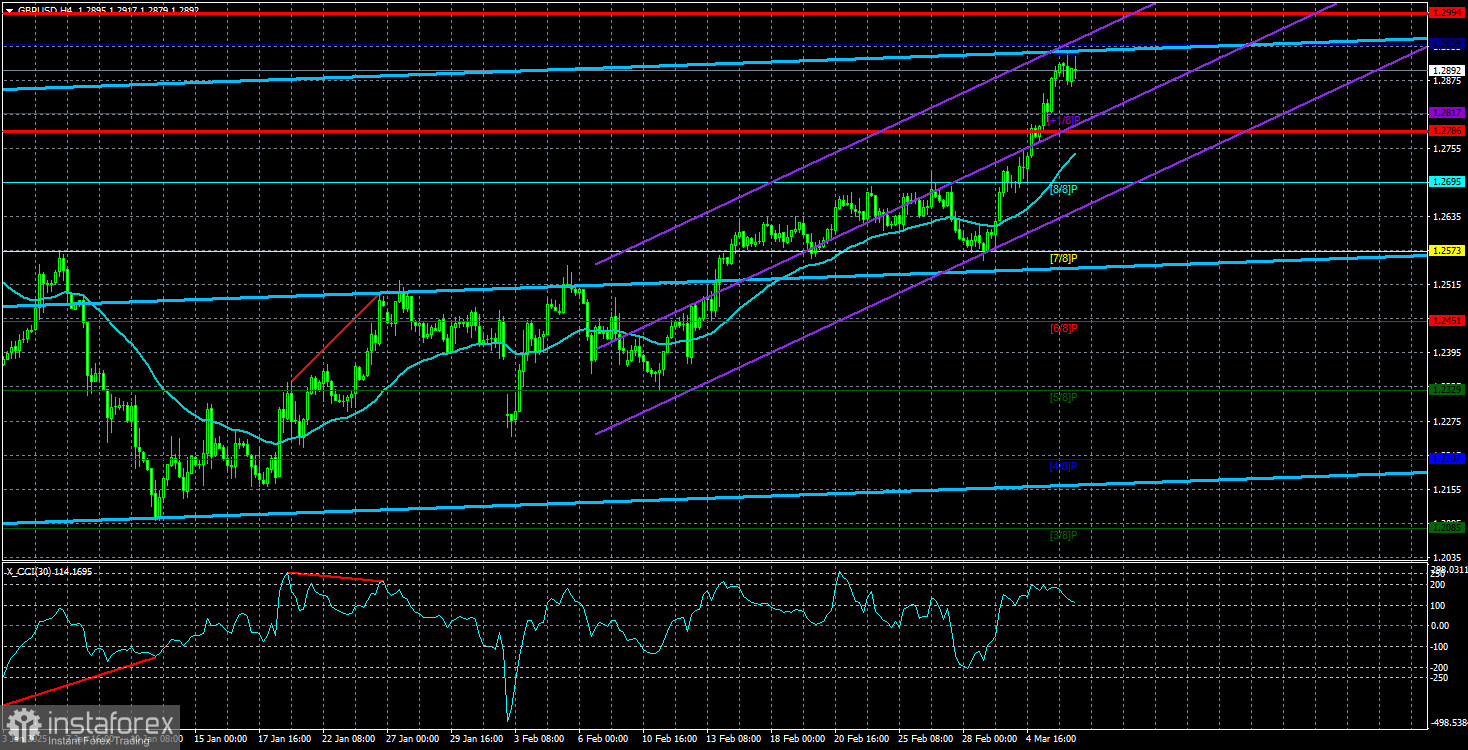
On the daily timeframe, the pair has precisely hit the 61.8% Fibonacci retracement level from the last downward move. This confirms a strong correction, yet it remains classified as a correction. In other words, the pair could resume its decline even from current levels. The 16-year global downtrend remains intact, as does the six-month medium-term downtrend. The pound has skyrocketed, but what comes next? Further gains will depend on new actions from Trump, which the market continues to interpret as negative for the U.S. economy.
GBP/USD Technical Outlook
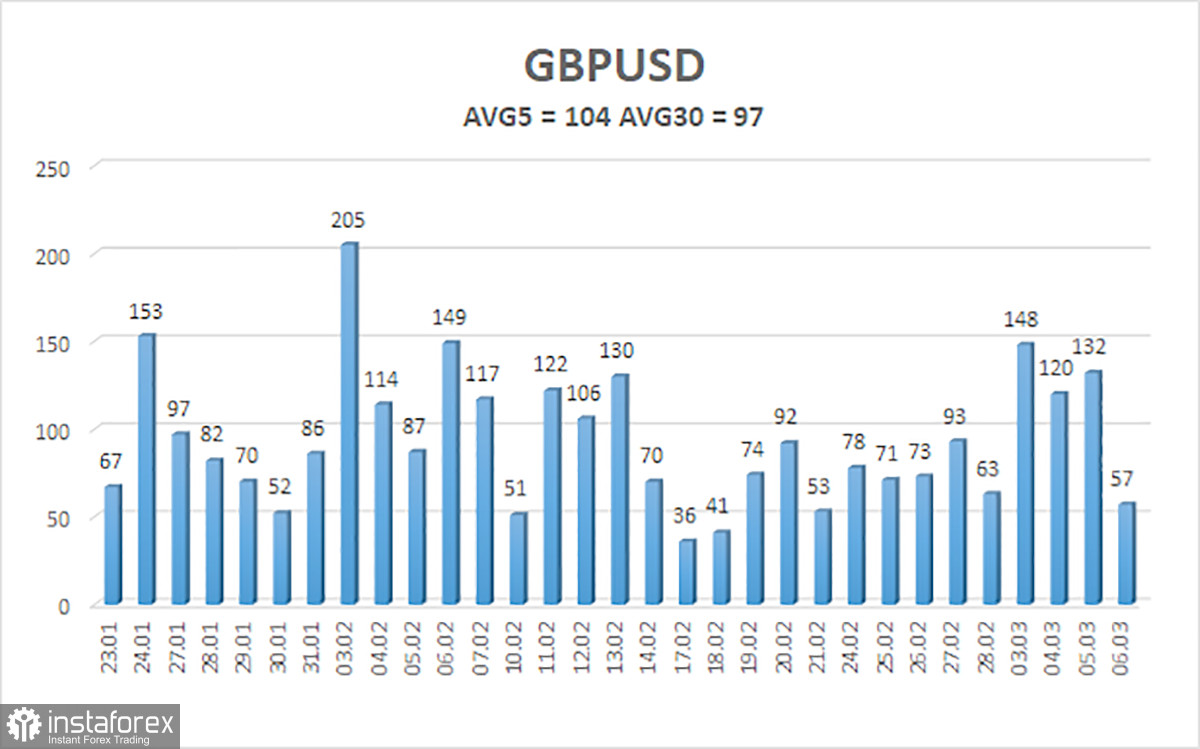
The average volatility of the GBP/USD pair over the last five trading days is 104 points, which is considered moderate for this pair. On Friday, March 7, price action is expected within the 1.2786–1.2994 range. The senior linear regression channel has flattened, but the downtrend remains visible on the daily chart. The CCI indicator recently entered the overbought zone, signaling a potential decline, though the pullback has been weak so far.
Key support levels: S1 – 1.2817 S2 – 1.2695 S3 – 1.2573
Key resistance level: R1 – 1.2939
Trading Strategy Recommendations
GBP/USD maintains a medium-term downtrend. Long positions remain unappealing, as the current rally still appears to be a panic-driven correction rather than a sustainable trend. If trading purely based on technical analysis, buying opportunities may emerge if price remains above the moving average, with targets at 1.2939 and 1.2994. However, selling remains the preferred strategy with targets at 1.2207 and 1.2146, as this upward correction will eventually exhaust itself. A confirmed break below the moving average is required to reinforce a bearish outlook. The pound is heavily overbought, yet Trump continues to drive the dollar lower.
Explanation of Technical Indicators
- Linear regression channels help determine the current trend. If both channels point in the same direction, the trend is strong.
- The moving average line (20,0, smoothed) defines the short-term trend and trading direction.
- Murray levels serve as target zones for price movements and corrections.
- Volatility levels (red lines) indicate the expected trading range for the next session, based on recent volatility trends.
- CCI indicator: A reading below -250 signals oversold conditions, while a reading above +250 indicates overbought levels, suggesting a potential trend reversal.