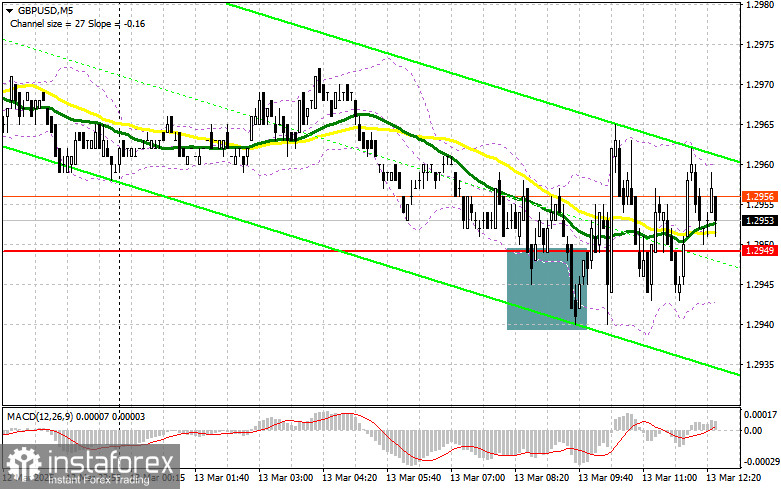
In my morning forecast, I focused on the 1.2949 level and planned to make trading decisions based on it. Let's look at the 5-minute chart and analyze what happened. A decline and a false breakout around 1.2949 provided an entry point for buying the pound, but the pair failed to see significant growth. The technical picture has not been revised for the second half of the day.
To Open Long Positions on GBP/USD:
Pound buyers remain present but have failed to provide any strong momentum. In the second half of the day, U.S. producer price data for February will be released. News of slowing price pressures could support further pound growth. Otherwise, I expect a correction in the pair, as yesterday's disregard for consumer price data and the sharp slowdown in the CPI index should not go unnoticed by traders.
I will only act on buying after a decline and the formation of a false breakout around the 1.2914 support level. This would provide a good entry point for long positions, aiming for a recovery toward the 1.2949 resistance level, where trading is currently concentrated. A breakout and retest of this range from top to bottom will create a new entry point for long positions, with the potential for an update to 1.2984, signaling a return to a bullish market. The furthest target will be 1.3028, where I plan to take profits.
If GBP/USD declines and bulls fail to show activity around 1.2914, pressure on the pound will increase, potentially leading to a sharp drop. In this case, only a false breakout around the 1.2876 low would serve as a suitable condition for opening long positions. I plan to buy GBP/USD immediately on a rebound from 1.2841, targeting an intraday correction of 30-35 points.
To Open Short Positions on GBP/USD:
Sellers remain on the sidelines for now. However, U.S. statistics could quickly bring major players back into the market, making it the key focus. The emphasis is currently on defending the 1.2984 resistance level, which also marks the weekly high. A false breakout at this level will provide a good selling opportunity, aiming for a decline toward 1.2949, the middle of the sideways channel. A breakout and retest of this range from below will trigger stop-loss orders, opening the way toward 1.2914, which would already represent a significant correction. The furthest target will be 1.2876, where I plan to take profits. A test of this level could halt further bullish market development.
If demand for the pound persists in the second half of the day and bears fail to act around 1.2984—which I personally doubt—selling should be postponed until the next resistance at 1.3028. I will open short positions there only after an unsuccessful consolidation. If there is no downward movement at that level, I will look for short positions around 1.3068, but only with the expectation of an intraday correction of 30-35 points.
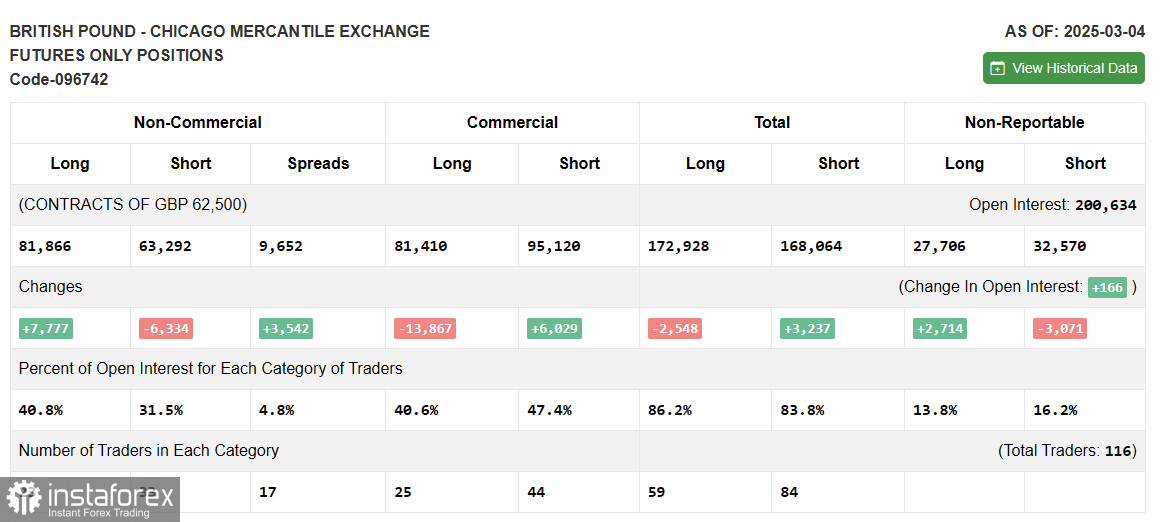
The Commitment of Traders (COT) report for March 4 showed a minimal increase in long positions and a reduction in short positions. The growing dominance of buyers makes further GBP/USD growth more likely. Considering the positive economic trends in the UK and the Bank of England's gradual approach to rate cuts, GBP/USD may continue its upward trajectory. However, corrections should not be ignored, as they could emerge on the path to updating local highs.
The COT report indicated that long non-commercial positions increased by 7,777, reaching 81,866, while short non-commercial positions declined by 6,334, reaching 63,292. As a result, the gap between long and short positions widened by 3,542.
Indicator Signals:
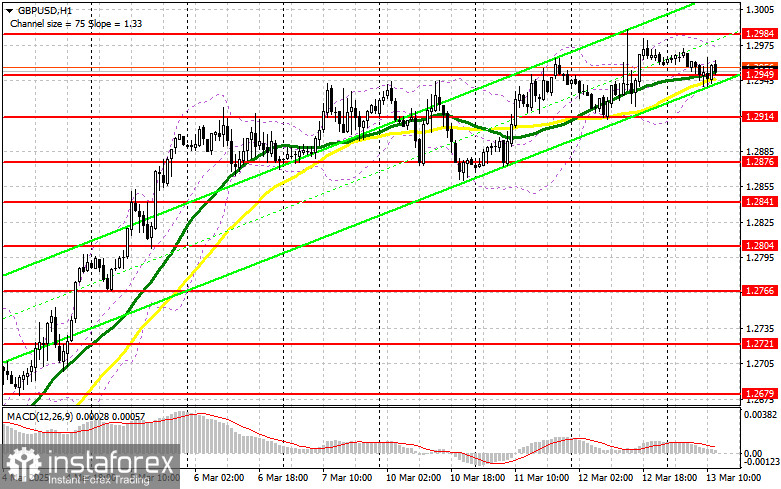
Moving Averages: Trading is occurring above the 30-day and 50-day moving averages, indicating further pair growth.
Note: The period and prices of moving averages analyzed by the author are based on the H1 chart and differ from the classic daily moving averages on the D1 chart.
Bollinger Bands: If the pair declines, the lower boundary of the indicator around 1.2949 will act as support.
Indicator Descriptions:
- Moving Average (MA): Determines the current trend by smoothing out volatility and noise.
- Period 50 (yellow on the chart)
- Period 30 (green on the chart)
- MACD (Moving Average Convergence/Divergence):
- Fast EMA – 12-period
- Slow EMA – 26-period
- SMA – 9-period
- Bollinger Bands: 20-period
- Non-commercial traders: Speculators, including individual traders, hedge funds, and large institutions using the futures market for speculative purposes.
- Long non-commercial positions: Total long open positions held by non-commercial traders.
- Short non-commercial positions: Total short open positions held by non-commercial traders.
- Net non-commercial position: The difference between short and long positions of non-commercial traders.