empty
21.12.2023 12:42 PM
The inflation report is the cause of all the troubles for the British pound

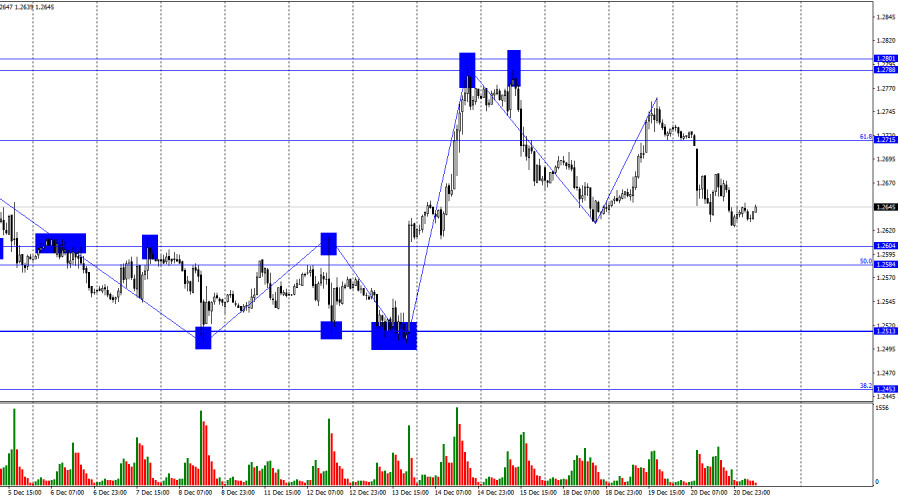
On the hourly chart, the GBP/USD pair reversed in favor of the US dollar on Wednesday, consolidating below the Fibonacci level of 61.8% (1.2715). A new decline towards the support zone of 1.2584–1.2604 began, which the bears have not reached yet. Today, this zone could be tested. A rebound from it would expect a reversal in favor of the euro and a return to the 61.8% level. Firmly establishing below 1.2584–1.2604 increases the probability of continued decline towards the levels of 1.2513 and 1.2453.

This image is no longer relevant

The wave situation is changing in favor of bearish traders. The last upward wave failed to surpass the previous peak (from December 15), thus providing the first sign of a trend change to a "bearish" one. The new downward wave broke the previous low by only a few points. Thus, the prospects for bears remain somewhat unclear, but I still anticipate that this wave is not yet complete, and its target – the zone of 1.2584–1.2604 – will be reached. The new "bearish" trend may take longer than it currently appears.

Yesterday, the inflation report for November in the UK ensured the pound's decline. Despite the skepticism about inflation reduction just a few months ago, Andrew Bailey, who forecasted a return below 5%, turned out to be right. As announced yesterday, the Consumer Price Index has dropped to 3.9%, with December still ahead. Inflation may fall even further before the New Year, much to the delight of the Bank of England.

However, the Bank of England must rejoice in this event in proud solitude. For the pound, news of inflation reduction is negative as it sharply reduces the chances of further tightening the Bank of England's policy. Yesterday, we saw firsthand how traders reacted to the decline in inflation. If today's US GDP report is not weaker than forecasted, bears will have excellent chances to push the zone of 1.2584–1.2604. I believe that in the coming days, a decline in the pair to the level of 1.2513, from which the price bounced three times before, is possible.

This image is no longer relevant

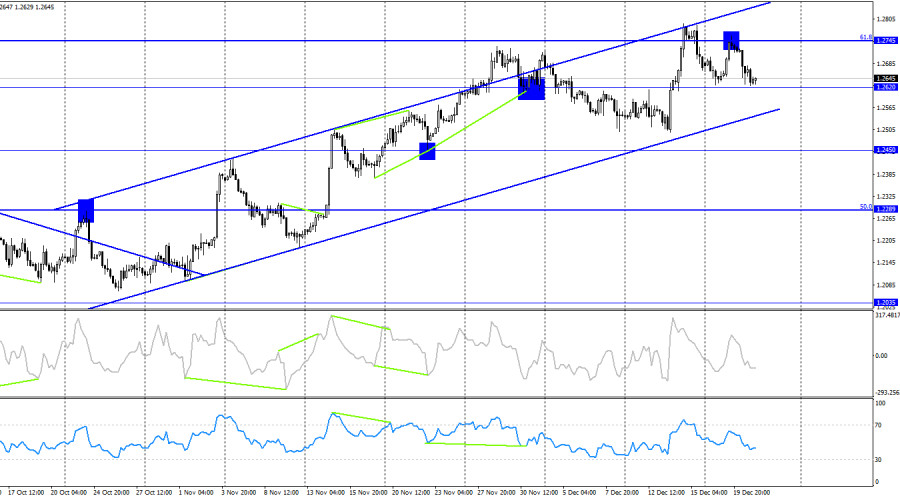
On the 4-hour chart, the pair consolidated below the corrective level of 61.8% (1.2745) and fell to 1.2620. Thus, quotes remain within the ascending trend corridor, and a rebound from its upper line and the level of 1.2745 suggests a decline to the lower line. I expect a significant pound drop only after consolidating below the ascending trend corridor. There are no apparent divergences with any indicator today. A rebound of quotes from the lower line of the ascending corridor will maintain the current "bullish" trend.

Forecast for GBP/USD and trader advice:

Sales of the pound could be opened on a rebound from the zone of 1.2788–1.2801 and on closing below the level of 1.2715. Currently, these deals can be kept open with a target of 1.2604. Today, traders can rely only on the US GDP report, which may support sellers who are simultaneously buyers of the dollar. However, a weaker GDP value than +5.2% will contribute to the pair's return to 1.2715. Purchases will be possible on a rebound from the zone of 1.2584–1.2604 on the hourly chart with a target of 1.2715, but caution is advised when buying the pound.

Pilih carta masa
5
min
15
min
30
min
1
jam
4
jam
1
hari
1
minggu
Jana pendapatan melalui perubahan kadar mata wang kripto dengan InstaForex.
Muat turun MetaTrader 4 dan buka dagangan pertama anda.
  • Grand Choice
    Contest by
    InstaForex
    InstaForex always strives to help you
    fulfill your biggest dreams.
    SERTAI PERADUAN

Artikel yang dicadangkan

EMAS. Harga Emas Berkemungkinan Menyusut Dengan Ketara Dalam Masa Terdekat

Harga emas baru-baru ini mengalami pembetulan yang ketara berikutan jangkaan pasaran terhadap permulaan rundingan sebenar antara Amerika Syarikat dan China berhubung tarif serta perdagangan secara keseluruhan. Kenyataan Setiausaha Perbendaharaan

Pati Gani 09:38 2025-04-24 UTC+2

Analisis Teknikal Pergerakan Harga Instrumen Komoditi Perak, Khamis 24 April 2025.

Pada carta 4 jam, instrumen komoditi Silver kelihatan meskipun keadaannya mengukuh di mana ini disahkan oleh pergerakan harga Silver yang bergerak di atas WMA (30 Shift 2) yang juga mempunyai

Arief Makmur 06:18 2025-04-24 UTC+2

Analisis Teknikal Pergerakan Harga Indeks Nasdaq 100, Khamis 24 April 2025.

Walaupun pada carta 4 jam indeks Nasdaq 100 berada dalam keadaan mendatar (Sideways), julat pergerakannya masih cukup luas, sekali gus menawarkan peluang yang agak menarik pada indeks ini. Ketika

Arief Makmur 06:18 2025-04-24 UTC+2

Isyarat Dagangan untuk EMAS (XAU/USD) bagi 23-25 April, 2025: jual di bawah $3,333 (200 EMA - 6/8 Murray)

Rancangan dagangan kami untuk beberapa jam akan datang adalah menjual emas di bawah $3,333, dengan sasaran pada $3,313 dan $3,291. Kami boleh membeli di atas $3,280 dengan sasaran jangka pendek

Dimitrios Zappas 14:31 2025-04-23 UTC+2

Analisis Teknikal Pergerakan Harga Harian Pasangan Mata Wang Silang AUD/JPY, Rabu, 23 April 2025.

Dengan kemunculan Divergence antara pergerakan harga pasangan mata wang silang AUD/JPY dengan penunjuk Pengayun Stochastic dan pergerakan harga AUD/JPY yang berada di atas WMA (30 Shift 2) yang juga mempunyai

Arief Makmur 06:37 2025-04-23 UTC+2

Analisis Teknikal Pergerakan Harga Intraday Instrumen Komoditi Emas, Rabu, 23 April 2025.

Jika kita melihat carta 4 jam, instrumen komoditi Emas masih menunjukkan kecenderungan Menaik, namun kemunculan Perbezaan (Divergence) antara pergerakan harga Emas dan penunjuk Pengayun Stochastic memberi isyarat bahawa dalam masa

Arief Makmur 06:37 2025-04-23 UTC+2

Analisis Teknikal Pergerakan Harga Intraday Pasangan Mata Wang Bersilang GBP/CHF, Selasa 22 April 2025.

Jika kita meneliti carta 4 jam bagi pasangan silang mata wang GBP/CHF, terdapat beberapa fakta menarik. Pertama sekali, kemunculan corak Segitiga yang diiringi oleh purata bergerak eksponen EMA (21) yang

Arief Makmur 06:58 2025-04-22 UTC+2

Analisis Teknikal Pergerakan Harga Harian bagi Pasangan Mata Wang Silang AUD/CAD, Selasa 22 April 2025.

Dengan pergerakan harga pasangan mata wang silang AUD/CAD bergerak di atas WMA (21) yang mempunyai cerun menaik dan penampilan Konvergensi antara pergerakan harga AUD/CAD dan penunjuk Pengayun Stochastic, ia memberikan

Arief Makmur 06:58 2025-04-22 UTC+2

Isyarat Dagangan EMAS (XAU/USD) untuk 21-25 April 2025: jual di bawah $3,422 (terlebih beli - 8/8 Murray)

Penunjuk eagle telah mencapai tahap terlebih beli. Walau bagaimanapun, logam tersebut masih boleh mencapai paras tinggi sekitar 8/8 Murray, yang mewakili rintangan kuat untuk emas. Di bawah kawasan ini, kita

Dimitrios Zappas 17:23 2025-04-21 UTC+2

Analisis Teknikal Pergerakan Harga Harian Pasangan Mata Wang Silang EUR/GBP, Isnin 21 April 2025

Dari pemerhatian pada carta 4 jam, pasangan mata wang silang EUR/GBP kelihatan bergerak di atas EMA (100), yang menunjukkan bahawa Pembeli mendominasi pasangan mata wang ini. Oleh itu, dalam masa

Arief Makmur 04:19 2025-04-21 UTC+2
Tidak boleh bertanya sekarang?
Tanya soalan anda di Ruangan bersembang.
Panggilan semula Widget
 

Dear visitor,

Your IP address shows that you are currently located in the USA. If you are a resident of the United States, you are prohibited from using the services of InstaFintech Group including online trading, online transfers, deposit/withdrawal of funds, etc.

If you think you are seeing this message by mistake and your location is not the US, kindly proceed to the website. Otherwise, you must leave the website in order to comply with government restrictions.

Why does your IP address show your location as the USA?

  • - you are using a VPN provided by a hosting company based in the United States;
  • - your IP does not have proper WHOIS records;
  • - an error occurred in the WHOIS geolocation database.

Please confirm whether you are a US resident or not by clicking the relevant button below. If you choose the wrong option, being a US resident, you will not be able to open an account with InstaForex anyway.

We are sorry for any inconvenience caused by this message.