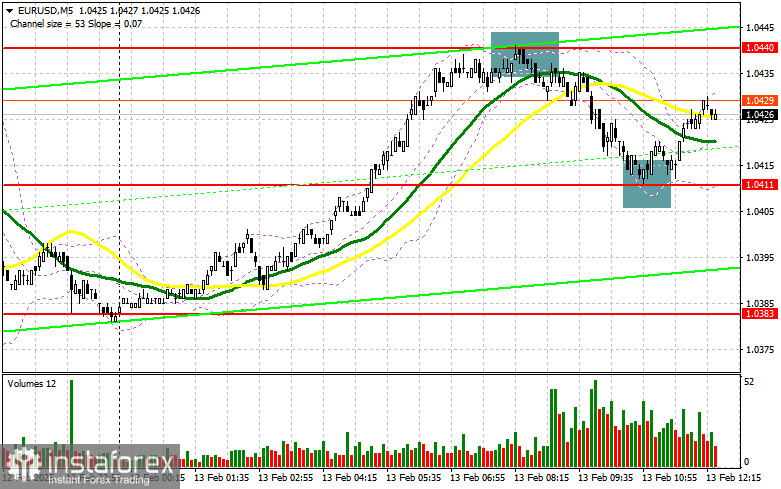
In my morning forecast, I focused on the 1.0440 level and planned to make trading decisions based on it. Let's examine the 5-minute chart to see what happened. A rise and false breakout at 1.0440 provided a strong short entry point, resulting in a 30-point decline. Buying at the 1.0411 support level on a similar signal secured about 15 points in profit. The technical outlook was revised for the second half of the day.
Long Position Strategy for EUR/USD:
German CPI data met economists' expectations, preventing the euro from extending its gains in the first half of the day. As a result, the pair remained within a sideways range, with only minor adjustments to key support levels.
In the second half of the session, markets will focus on the U.S. Producer Price Index (PPI), both overall and core, as well as the weekly jobless claims report. Stronger-than-expected figures could increase pressure on the euro, while weaker data may spark a new bullish movement.
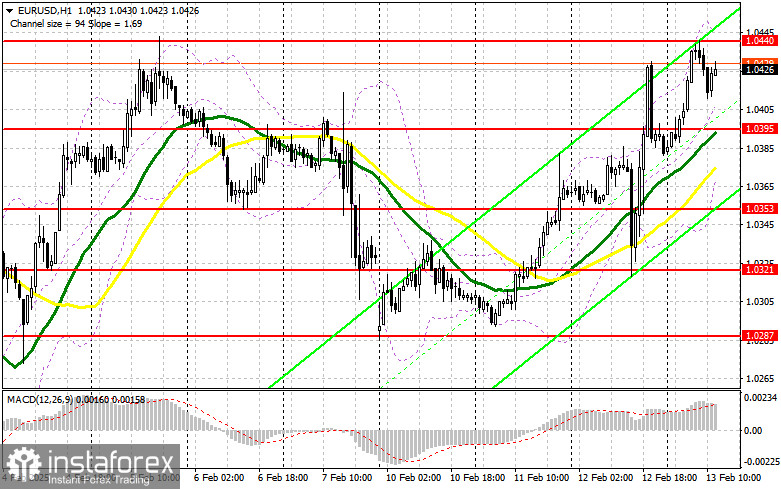
If EUR/USD declines due to strong data, I will look for a false breakout at 1.0395 to enter a long position, targeting resistance at 1.0440—which has remained a key barrier. A break and retest of this level will confirm a buying opportunity, pushing EUR/USD towards 1.0468. The final target will be 1.0495, where I plan to lock in profits.
If EUR/USD drops further and no buying interest appears at 1.0395, buyers may lose momentum, allowing sellers to drive the pair to 1.0353. Only after a false breakout at this level will I consider long positions. I also plan to buy immediately on a bounce from 1.0321, aiming for a 30-35 point intraday correction.
Short Position Strategy for EUR/USD:
Sellers successfully defended 1.0440, leading to a significant euro sell-off in the morning session. Moving forward, caution is required since U.S. inflation data could surprise the market.
A false breakout at 1.0440, similar to the morning setup, will confirm the presence of strong sellers, providing a short entry opportunity targeting support at 1.0395. This level also coincides with the 30- and 50-period moving averages, which currently support the bulls.
A break below 1.0395, especially with strong U.S. economic data, followed by a retest from below, will offer another short setup, aiming for a new low at 1.0353, signaling a potential bearish reversal. The final downside target will be 1.0321, where I will take profits.
If EUR/USD rises in the second half of the session and sellers fail to act at 1.0440, buyers may push the pair higher. In this case, I will delay short entries until 1.0468, looking for a false breakout. If the pair reaches 1.0495, I will short immediately, targeting a 30-35 point pullback.
Commitment of Traders (COT) Report Analysis:
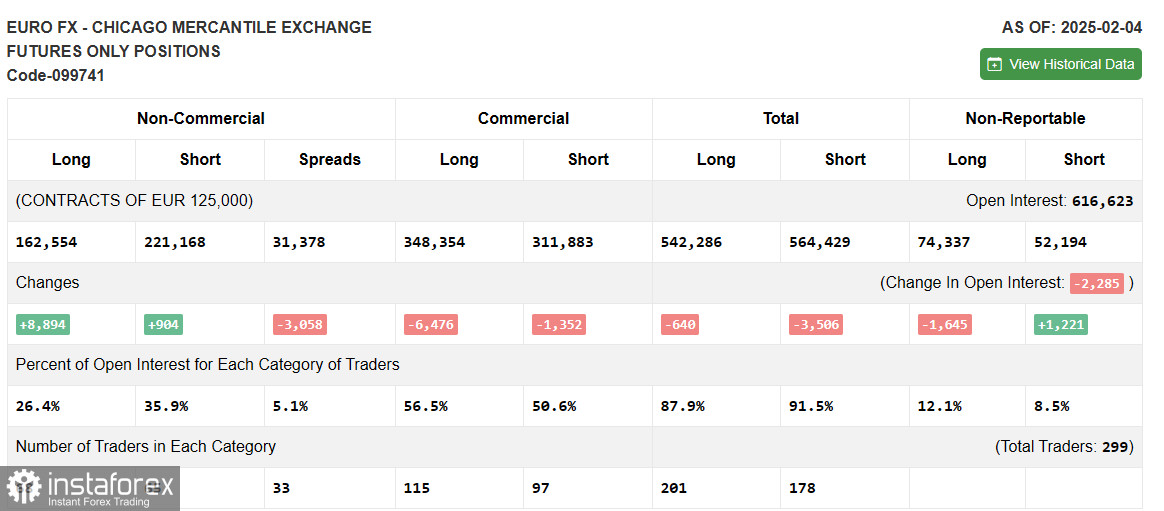
The February 4 COT report showed an increase in both long and short positions. More traders showed interest in buying the euro after concerns over a potentially aggressive U.S. trade war under Donald Trump eased. However, these data do not yet reflect the strong U.S. labor market report or the new steel and aluminum tariffs, suggesting that the outlook remains uncertain.
Risky asset purchases should be approached cautiously, as the trade war is just beginning. Long non-commercial positions increased by 8,894 to 162,554. Short non-commercial positions increased by 904 to 221,168. The gap between long and short positions narrowed by 3,058.
Indicator Signals
Moving Averages
EUR/USD is trading above the 30- and 50-day moving averages, signaling further potential upside.
Note: The author uses H1 chart moving averages, which may differ from traditional daily moving averages on the D1 chart.
Bollinger Bands
If EUR/USD declines, the lower Bollinger Band near 1.0385 will serve as support.
Technical Indicator Descriptions:
- Moving Average (MA) – identifies the current trend by smoothing out volatility and noise.
- 50-period MA (yellow on the chart)
- 30-period MA (green on the chart)
- MACD (Moving Average Convergence/Divergence) – identifies trend momentum.
- Fast EMA: 12-period
- Slow EMA: 26-period
- SMA: 9-period
- Bollinger Bands (BB) – measures volatility and overbought/oversold conditions.
- Non-commercial traders – speculators, including retail traders, hedge funds, and institutional investors, using futures markets for speculative purposes.
- Long non-commercial positions – total long open positions among non-commercial traders.
- Short non-commercial positions – total short open positions among non-commercial traders.
- Net non-commercial position – the difference between long and short positions of non-commercial traders.