empty
 
 
14.02.2025 05:35 AM
Overview of the EUR/USD Pair on February 14: Flat and Confusion Persist

This image is no longer relevant

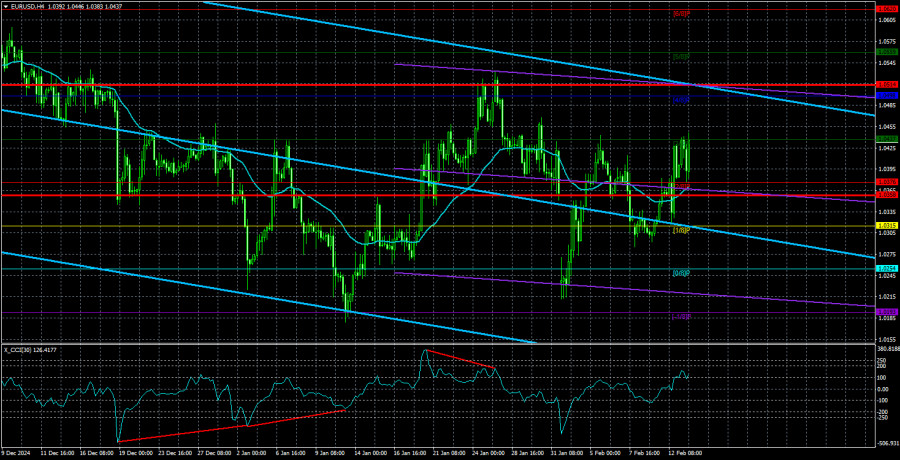
On Thursday, the EUR/USD currency pair attempted to continue its upward movement, but this effort was largely unsuccessful, leading to a decline in the latter half of the day. Overall, the EUR/USD remains in a flat market, best described as chaotic and directionless. The primary reason for this is the lack of clearly defined boundaries within the range. On Wednesday, the pair rose without any strong fundamental basis. Although the key report of the day, U.S. inflation data, showed strong performance for the dollar, the greenback still declined. On Thursday, the macroeconomic data was largely insignificant, yet it was the euro that fell, highlighting the illogical nature of the current price movements.

The key takeaway is that a correction is ongoing on the daily timeframe. Consequently, on the 4-hour chart and lower timeframes, traders are witnessing erratic price action and rapidly alternating trends. Corrections are typically characterized by complex movements, frequent pullbacks, and weak impulses. As a result, traders tend to avoid opening new positions in the direction of a correction. During an upward correction, few are inclined to open long positions. Instead, corrections serve as consolidation periods, during which large players reassess their expectations and accumulate long-term positions, which will only manifest on the charts later.

Among Thursday's economic releases, one report stands out: the Eurozone industrial production data. As expected, production volumes declined again, and the actual figures fell short of forecasts, which was not surprising. This could have contributed to the overall decline in the euro. However, it is essential to remember that most fundamental and macroeconomic factors still favor the U.S. dollar. We believe that the correction on the daily timeframe is not over, as it still appears weak. The current fundamental backdrop, particularly recent news, could prompt traders to resume the downtrend that has persisted for the past four months, along with the broader 16-year bearish trend. For now, the euro is managing to hold its ground, but just barely.

This image is no longer relevant

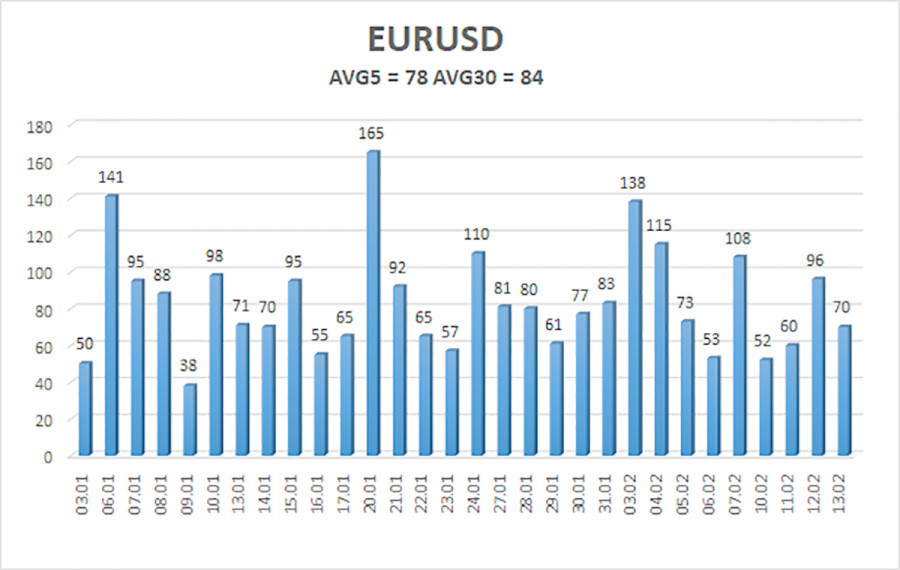
As of February 14, the average volatility of the EUR/USD currency pair over the last five trading days is 78 pips, which is classified as "average." On Friday, we expect the pair to trade between 1.0358 and 1.0514. The higher linear regression channel remains downward, indicating that the global downtrend persists. The CCI indicator recently entered the oversold zone, after which it began to rise from the bottom.

Nearest Support Levels:

S1 – 1.0376

S2 – 1.0315

S3 – 1.0254

Nearest Resistance Levels:

R1 – 1.0437

R2 – 1.0498

R3 – 1.0559

Trading Recommendations:

The EUR/USD pair has sharply resumed its downward movement but quickly rebounded. Over the past few months, we have consistently maintained that the medium-term outlook for the euro is bearish, which remains unchanged. The Federal Reserve has paused its monetary easing, while the European Central Bank is, on the contrary, accelerating it. This means that the U.S. dollar still has no fundamental reasons for a medium-term decline apart from purely technical and corrective factors. Short positions remain much more attractive, but a technical correction may continue.

For those trading purely on technical analysis, long positions can be considered only if the price is above the moving average, with targets at 1.0498 and 1.0514. However, any upward movement on the daily timeframe is still classified as a correction.

Explanation of Illustrations:

Linear Regression Channels help determine the current trend. If both channels are aligned, it indicates a strong trend.

Moving Average Line (settings: 20,0, smoothed) defines the short-term trend and guides the trading direction.

Murray Levels act as target levels for movements and corrections.

Volatility Levels (red lines) represent the likely price range for the pair over the next 24 hours based on current volatility readings.

CCI Indicator: If it enters the oversold region (below -250) or overbought region (above +250), it signals an impending trend reversal in the opposite direction.

Paolo Greco,
انسٹافاریکس کا تجزیاتی ماہر
© 2007-2025
انسٹافاریکس کے ساتھ کرپٹو کرنسی کی معاملاتی تبدیلیوں سے کمائیں۔
میٹا ٹریڈر 4 ڈاؤن لوڈ کریں اور اپنی پہلی ٹریڈ کھولیں۔
  • Grand Choice
    Contest by
    InstaForex
    InstaForex always strives to help you
    fulfill your biggest dreams.
    مقابلہ میں شامل ہوں
  • چانسی ڈیپازٹ
    اپنے اکاؤنٹ میں 3000 ڈالر جمع کروائیں اور حاصل کریں$1000 مزید!
    ہم فروری قرعہ اندازی کرتے ہیں $1000چانسی ڈیپازٹ نامی مقابلہ کے تحت
    اپنے اکاؤنٹ میں 3000 ڈالر جمع کروانے پر موقع حاصل کریں - اس شرط پر پورا اُترتے ہوئے اس مقابلہ میں شرکت کریں
    مقابلہ میں شامل ہوں
  • ٹریڈ وائز، ون ڈیوائس
    کم از کم 500 ڈالر کے ساتھ اپنے اکاؤنٹ کو ٹاپ اپ کریں، مقابلے کے لیے سائن اپ کریں، اور موبائل ڈیوائسز جیتنے کا موقع حاصل کریں۔
    مقابلہ میں شامل ہوں
  • 100 فیصد بونس
    اپنے ڈپازٹ پر 100 فیصد بونس حاصل کرنے کا آپ کا منفرد موقع
    بونس حاصل کریں
  • 55 فیصد بونس
    اپنے ہر ڈپازٹ پر 55 فیصد بونس کے لیے درخواست دیں
    بونس حاصل کریں
  • 30 فیصد بونس
    ہر بار جب آپ اپنا اکاؤنٹ ٹاپ اپ کریں تو 30 فیصد بونس حاصل کریں
    بونس حاصل کریں

تجویز کردہ مضامین

ابھی فوری بات نہیں کرسکتے ؟
اپنا سوال پوچھیں بذریعہ چیٹ.
Widget callback