GBP/USD 5-Minute Analysis
The GBP/USD currency pair experienced fluctuations on Monday. There were no notable events in either the UK or the U.S., and Donald Trump did not announce any new tariffs, leaving the market with little to react to. Despite this, the British pound remains close to its highs and does not seem eager to initiate even a minor correction. Although there was a sharp decline in the U.S. dollar last week, we continue to support its recovery. If Trump continues to impose new sanctions weekly, the dollar may struggle to regain its strength. However, we believe last week's drop was excessive, and at the very least, a correction is warranted.
From a technical perspective, the hourly time frame lacks clear conclusions. The recent rally of the British pound has been so steep that forming a trend line is impossible. Therefore, traders should focus on key levels and lines. Important news is expected on Wednesday and Friday, but we are anticipating at least a correction following such strong growth.
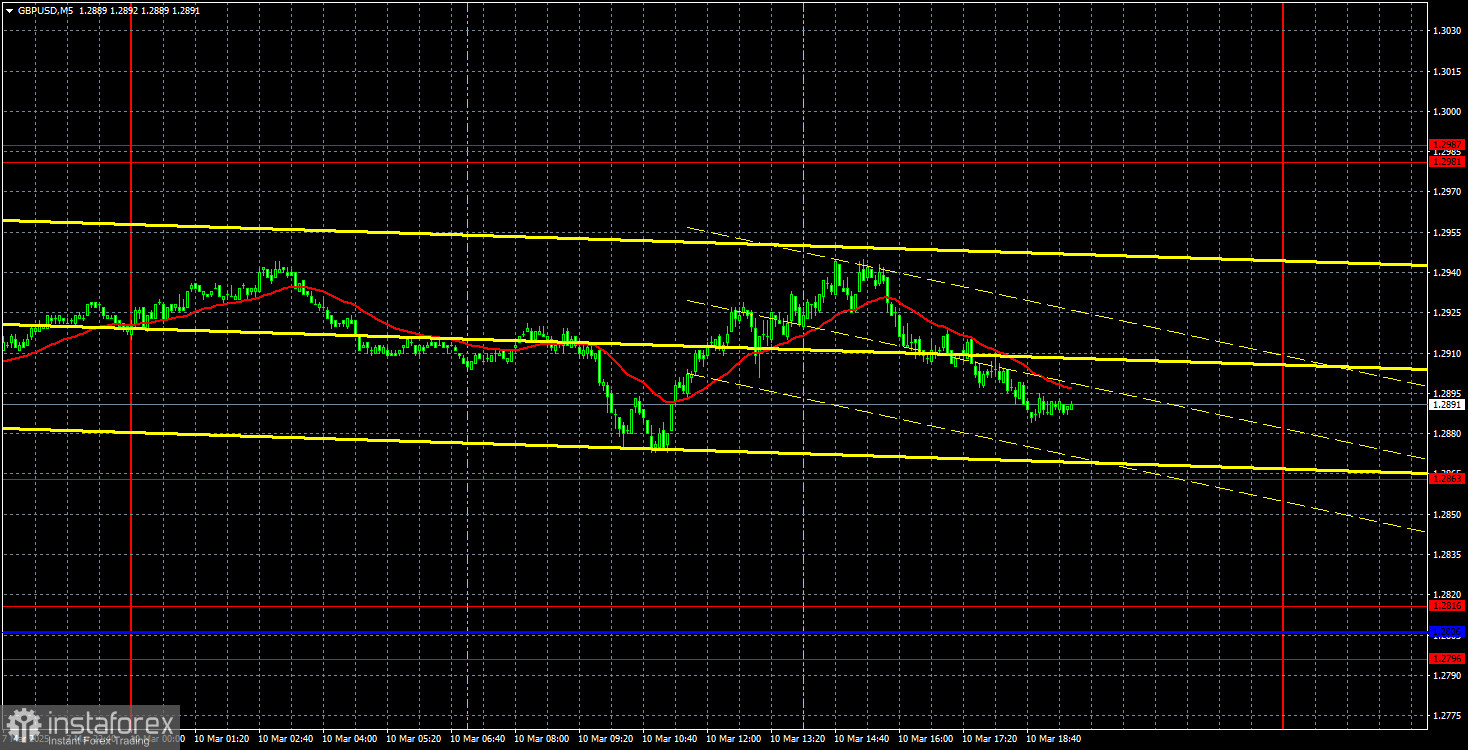
In the 5-minute time frame, there were no valid trading signals on Monday, which may have worked out for the best. The price approached the 1.2863 level once but fell short by 10 pips, which cannot be considered a trading error.
COT Report
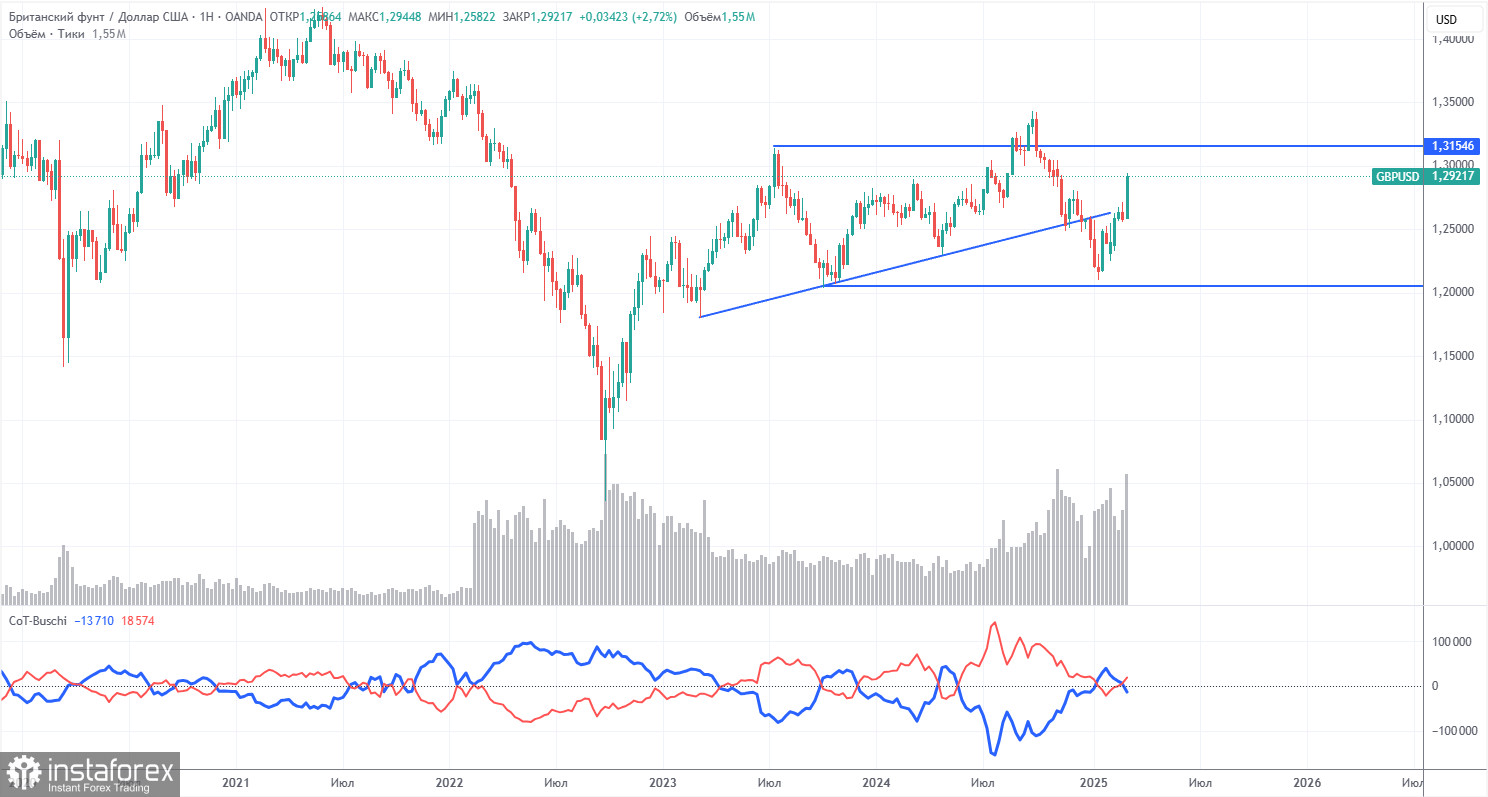
COT reports for the British pound indicate that the sentiment among commercial traders has been fluctuating in recent years. The red and blue lines, representing the net positions of commercial and non-commercial traders, frequently intersect and typically hover around the zero line. Currently, these lines are close to each other, indicating a roughly equal number of buy and sell positions.
On the weekly timeframe, the price initially broke the 1.3154 level before dropping to the trend line, which it subsequently broke through. This break suggests that the pound's decline is likely to continue. However, there was also a bounce from the second-to-last local low on the weekly chart, which could imply a flat market.
According to the latest COT report on the British pound, the "Non-commercial" group opened 7,800 buy contracts and closed 6,300 sell contracts. Consequently, the net position of non-commercial traders increased by 14,100 contracts over the week, which does not significantly favor the pound.
The fundamental backdrop still offers no solid reasons for long-term investments in the British pound, and the currency faces a real possibility of continuing its global downtrend. Although the pound has recently experienced a notable increase, the underlying cause appears to be related to Donald Trump's policies.
GBP/USD 1-Hour Analysis
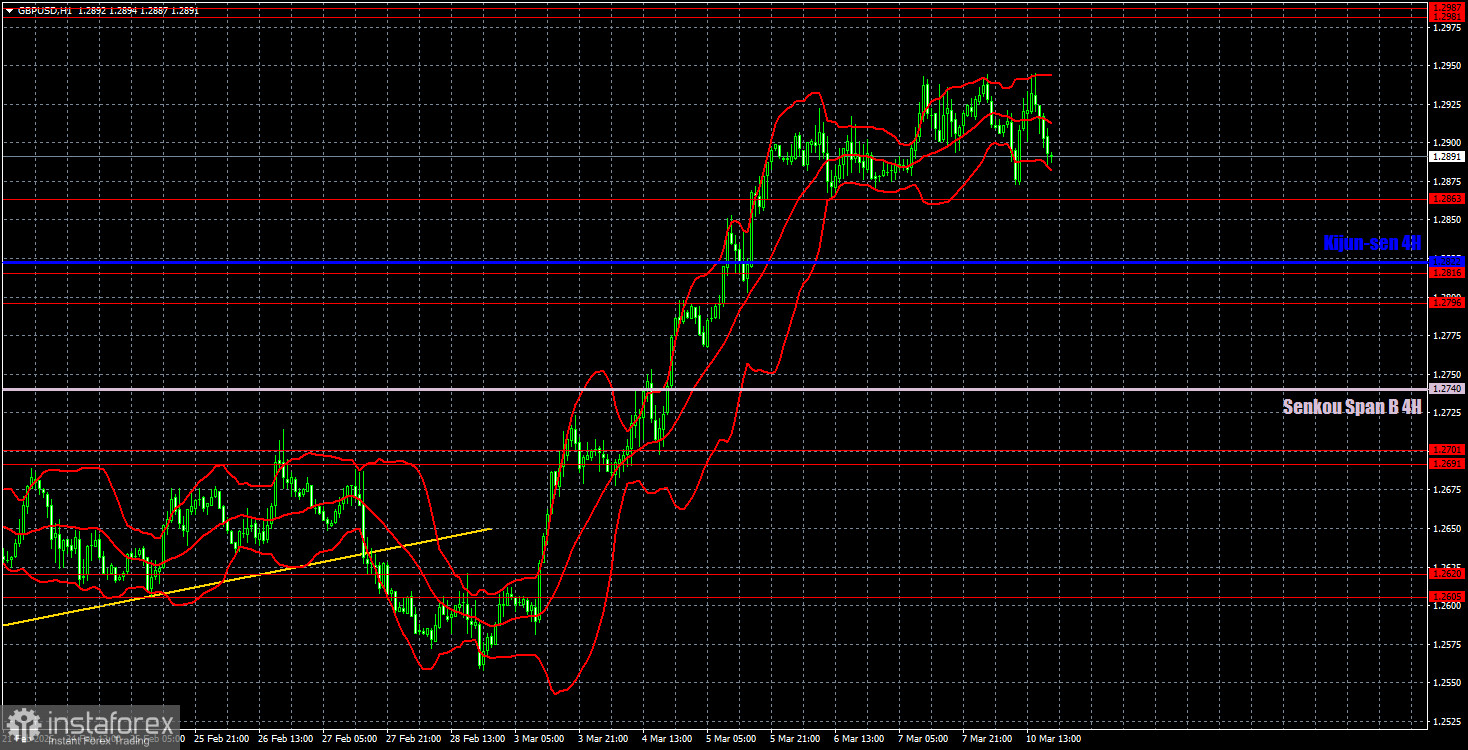
In the hourly time frame, the GBP/USD pair continues its uptrend, which resembles a dollar collapse. This could be just another phase in a series of shifting trends within a broader upward correction on the daily time frame, but this correction is already overdue for completion. We still do not see any fundamental reasons for the British pound to sustain long-term growth. The only supporting factor for the pound now is Donald Trump, who appears to be unconventionally devaluing the dollar. Other market factors are being ignored. Once they come into play, the dollar could regain strength.
For March 11, the following key levels are highlighted: 1.2237-1.2255, 1.2331-1.2349, 1.2429-1.2445, 1.2511, 1.2605-1.2620, 1.2691-1.2701, 1.2796-1.2816, 1.2863, 1.2981-1.2987, 1.3050. The Senkou Span B (1.2740) and Kijun-sen (1.2822) lines can also serve as sources of signals. A Stop Loss should be placed at breakeven once the price moves 20 pips in the right direction. The Ichimoku indicator lines may shift throughout the day, so traders should consider this when analyzing signals.
On Tuesday, the UK economic calendar will be empty, while the JOLTs job openings report will be released in the U.S. However, this report is neither highly significant nor timely, as it was published with a two-month delay. Therefore, its impact on the market will likely be minimal. If the pound begins to decline, it certainly won't be because of this report.
Illustration Explanations:
- Support and Resistance Levels (thick red lines): Thick red lines indicate where movement may come to an end. Please note that these lines are not sources of trading signals.
- Kijun-sen and Senkou Span B Lines: Ichimoku indicator lines transferred from the 4-hour timeframe to the hourly timeframe. These are strong lines.
- Extreme Levels (thin red lines): Thin red lines where the price has previously bounced. These serve as sources of trading signals.
- Yellow Lines: Trendlines, trend channels, or any other technical patterns.
- Indicator 1 on COT Charts: Represents the net position size for each category of traders.