Analysis of Friday's Trades
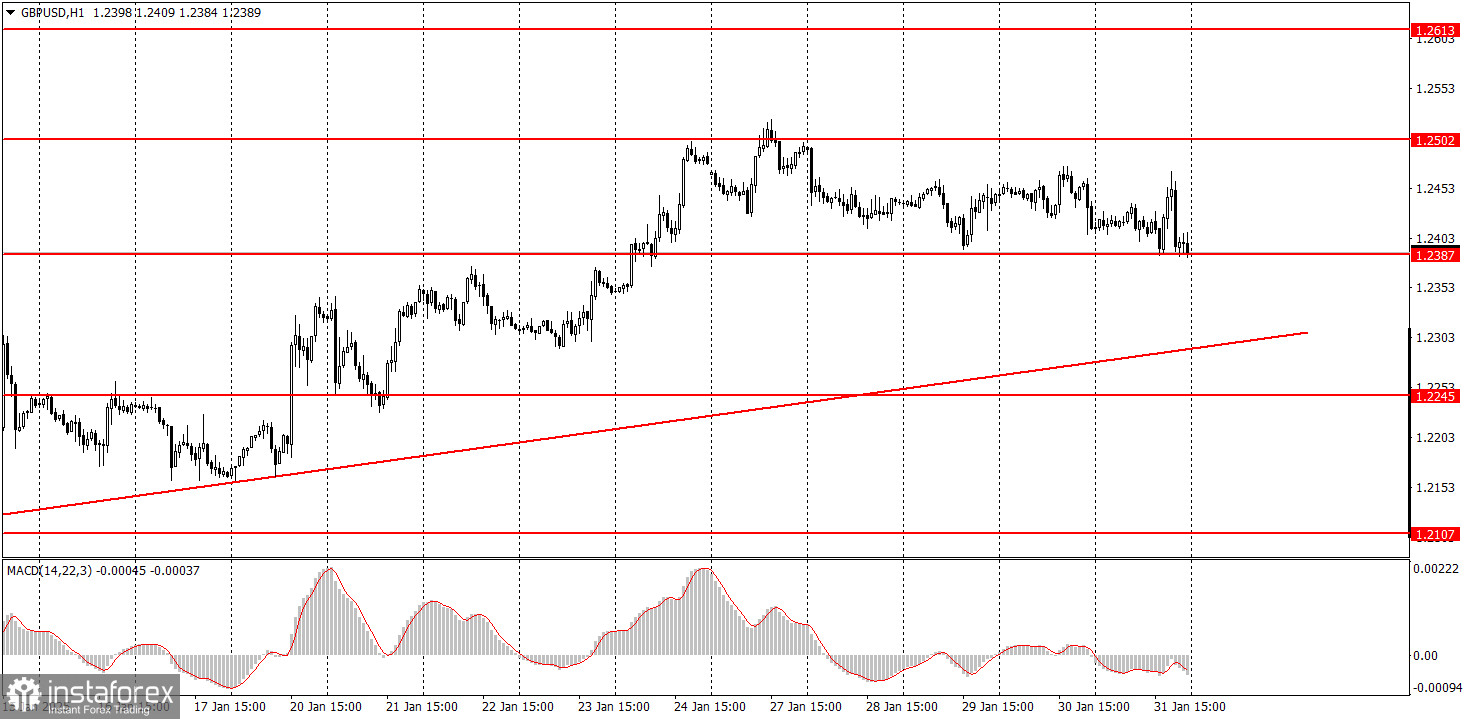
1H Chart of GBP/USD
On Friday, the GBP/USD pair showed a tendency to decline but failed to break below the 1.2387 level once again. The British pound has been trading in a sideways range between 1.2387 and 1.2502 for over a week. Similarly, the euro has also remained stagnant, despite having several reasons to experience a sharp decline this week. If the euro had fallen, the pound sterling likely would have followed suit. It appears that the euro's lack of movement has prevented the pound from falling further, even though it should have been trending downward. Overall, it has been a peculiar week in terms of price movements. Throughout the week, we saw the release of GDP data from Germany, the EU, and the U.S., along with meetings from the ECB and the Fed. While most of these events had little direct impact on the pound, the overall flat movement has raised many questions. Next week, the Bank of England will hold its meeting, and the U.S. will release reports on the labor market and unemployment. There are plenty of reasons to anticipate strong movements again. For now, however, as long as the pair remains within this sideways channel, that pattern will dominate.
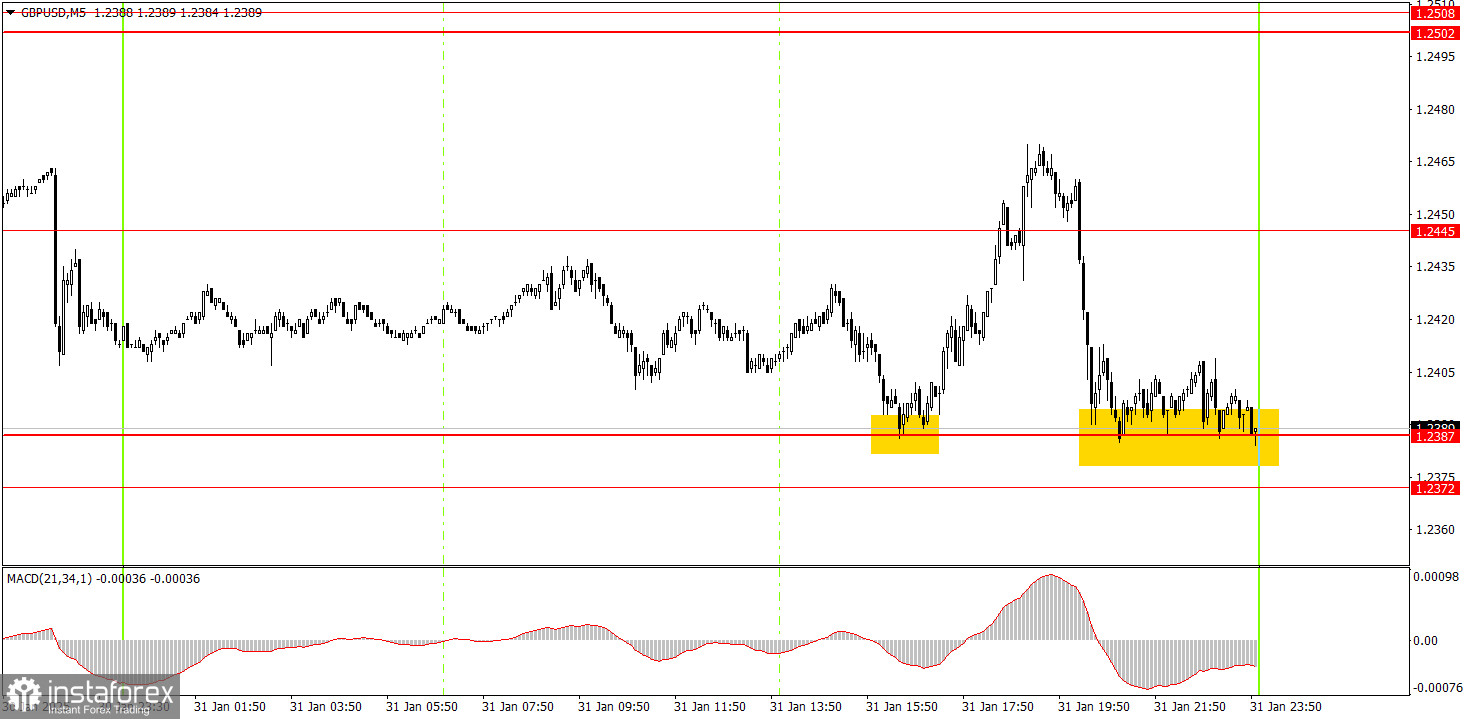
5M Chart of GBP/USD
In the 5-minute timeframe, Friday's movements and signals were quite notable. During the U.S. trading session, the price rebounded from the 1.2387 level, rising by about 70 pips before quickly reversing and returning to 1.2387. After the price consolidated below 1.2445, novice traders could have closed their long positions and even opened short positions. In either case, one or two trades would likely have been profitable, although the movements were quite unusual.
Trading Strategy for Monday:
During the hourly timeframe, the GBP/USD pair forms a short-term uptrend, essentially a correction. In the medium term, we fully support the pound's decline towards 1.1800, as we believe this is the only logical outcome. Therefore, we are now just waiting for the downtrend to resume. The trendline will help determine when the current correction ends.
On Monday, the GBP/USD pair may at least attempt to continue its downward retracement, as the 1.2502-1.2508 area has not yet been breached. However, movements are strange and erratic, with a sideways trend observed over the past week.
In the 5-minute timeframe, trading can be based on the following levels: 1.2010, 1.2052, 1.2089-1.2107, 1.2164-1.2170, 1.2241-1.2270, 1.2301, 1.2372-1.2387, 1.2445, 1.2502-1.2508, 1.2547, 1.2633, 1.2680-1.2685, 1.2723, 1.2791-1.2798. On Monday, the U.K. and the U.S. will release their manufacturing PMI indices. Particular attention should be paid to the U.S. ISM Manufacturing Index, as it could significantly impact the movement of the currency pair.
Core Trading System Rules:
- Signal Strength: The shorter the time it takes for a signal to form (a rebound or breakout), the stronger the signal.
- False Signals: If two or more trades near a level result in false signals, subsequent signals from that level should be ignored.
- Flat Markets: In flat conditions, pairs may generate many false signals or none at all. It's better to stop trading at the first signs of a flat market.
- Trading Hours: Open trades between the start of the European session and the middle of the US session, then manually close all trades.
- MACD Signals: On the hourly timeframe, trade MACD signals only during periods of good volatility and a clear trend confirmed by trendlines or trend channels.
- Close Levels: If two levels are too close (5–20 pips apart), treat them as a support or resistance zone.
- Stop Loss: Set a Stop Loss to breakeven after the price moves 20 pips in the desired direction.
Key Chart Elements:
Support and Resistance Levels: These are target levels for opening or closing positions and can also serve as points for placing Take Profit orders.
Red Lines: Channels or trendlines indicating the current trend and the preferred direction for trading.
MACD Indicator (14,22,3): A histogram and signal line used as a supplementary source of trading signals.
Important Events and Reports: Found in the economic calendar, these can heavily influence price movements. Exercise caution or exit the market during their release to avoid sharp reversals.
Forex trading beginners should remember that not every trade will be profitable. Developing a clear strategy and practicing proper money management are essential for long-term trading success.