Analysis of Wednesday's Trades
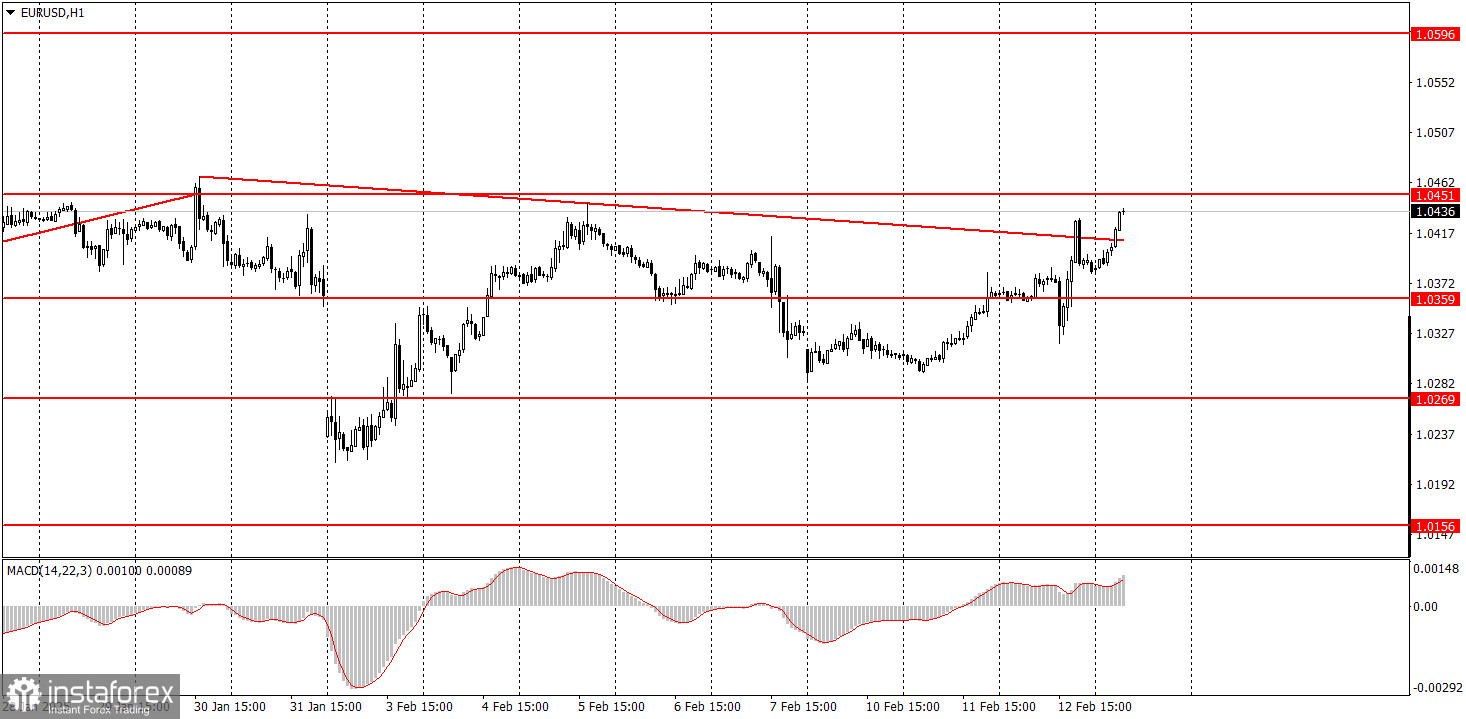
1H Chart of EUR/USD
The EUR/USD currency pair experienced significant growth on Tuesday, with the upward trend continuing overnight. What caused the euro to rise? The day was marked by the release of U.S. inflation data. Many traders anticipated that inflation would either slow down slightly or remain unchanged, especially since Jerome Powell had repeatedly indicated that the disinflationary process would continue. However, contrary to these forecasts, inflation increased for the fourth consecutive time.
This outcome typically should have led to a strong appreciation of the U.S. dollar, as the likelihood of a Federal Reserve rate cut in 2025 is now approaching zero. Nevertheless, the dollar's growth was short-lived. This can be attributed to an ongoing upward correction on the daily timeframe, which has been frequently discussed. Despite 90% of factors suggesting a further strengthening of the U.S. dollar, the market has not yet completed its correction or prepared for a new decline in the currency pair. As a result, we witnessed the euro rising when a decline was expected.
Moreover, the upward correction may continue for several more weeks, and on the hourly timeframe, it will still appear as alternating trends.
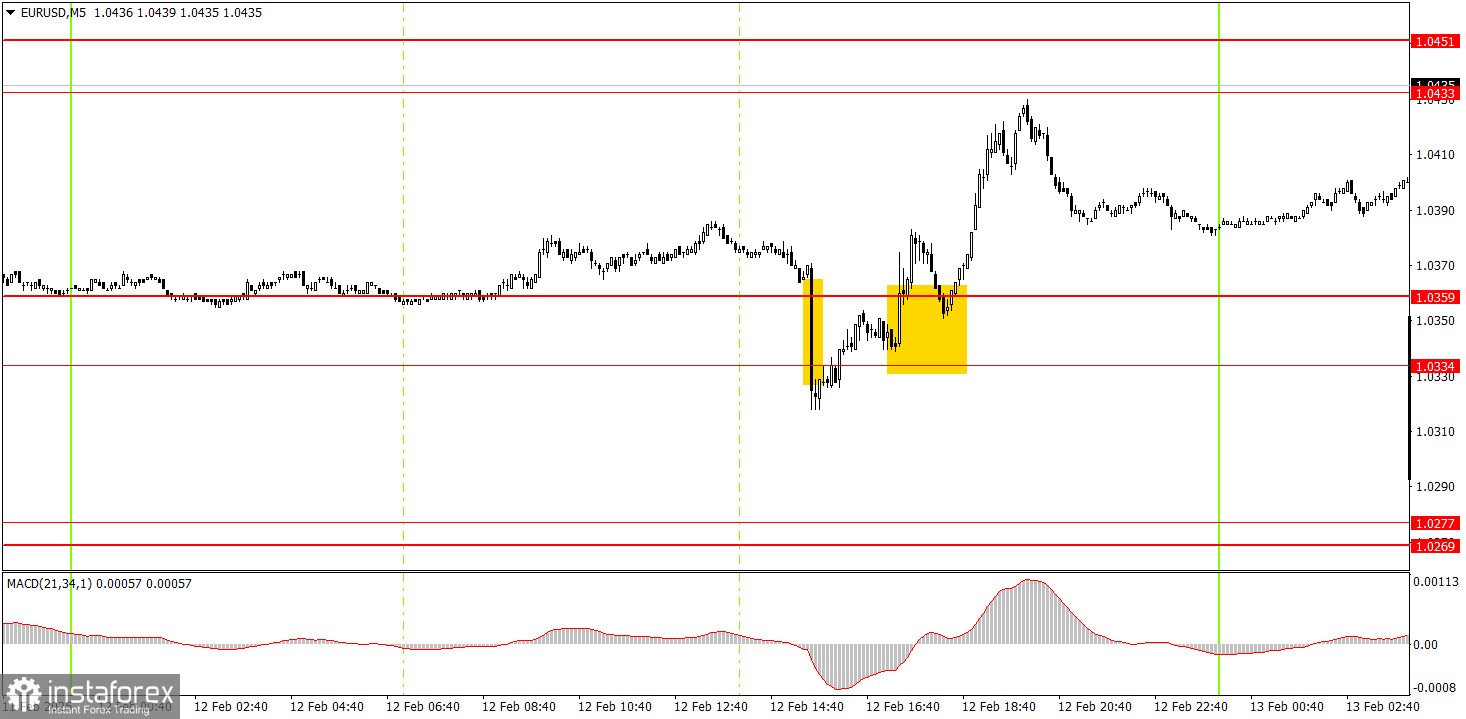
5M Chart of EUR/USD
On the 5-minute timeframe on Wednesday, two trading signals were formed, but both could easily be ignored. The first signal occurred when the price consolidated below the 1.0334-1.0359 area, but this happened immediately after the inflation report was published, making it difficult to enter the market in time. The second signal was a consolidation above the same area, but opening long positions when a critical report supports a decline was illogical.
Trading Strategy for Thursday:
On the hourly timeframe, EUR/USD is currently in a medium-term downtrend, having seen a local uptrend that was both canceled and quickly resumed. Given the ongoing fundamental and macroeconomic factors that favor the U.S. dollar, a decline in the euro is anticipated. However, the upward correction observed on the daily timeframe may continue for several more weeks.
On Thursday, market movements may remain quite erratic as the correction phase is still underway. While trading can proceed based on technical levels, it should be approached with extreme caution.
For the 5-minute timeframe, the key levels to monitor are: 1.0156, 1.0221, 1.0269-1.0277, 1.0334-1.0359, 1.0433-1.0451, 1.0526, 1.0596, 1.0678, 1.0726-1.0733, 1.0797-1.0804, and 1.0845-1.0851. On Thursday, the Eurozone will release industrial production data, alongside Germany's second inflation estimate; however, both reports are not expected to have a significant impact. In the U.S., the focus will be on jobless claims and producer price index reports, which are anticipated to be even less influential.
Core Trading System Rules:
- Signal Strength: The shorter the time it takes for a signal to form (a rebound or breakout), the stronger the signal.
- False Signals: If two or more trades near a level result in false signals, subsequent signals from that level should be ignored.
- Flat Markets: In flat conditions, pairs may generate many false signals or none at all. It's better to stop trading at the first signs of a flat market.
- Trading Hours: Open trades between the start of the European session and the middle of the US session, then manually close all trades.
- MACD Signals: On the hourly timeframe, trade MACD signals only during periods of good volatility and a clear trend confirmed by trendlines or trend channels.
- Close Levels: If two levels are too close (5–20 pips apart), treat them as a support or resistance zone.
- Stop Loss: Set a Stop Loss to breakeven after the price moves 15 pips in the desired direction.
Key Chart Elements:
Support and Resistance Levels: These are target levels for opening or closing positions and can also serve as points for placing Take Profit orders.
Red Lines: Channels or trendlines indicating the current trend and the preferred direction for trading.
MACD Indicator (14,22,3): A histogram and signal line used as a supplementary source of trading signals.
Important Events and Reports: Found in the economic calendar, these can heavily influence price movements. Exercise caution or exit the market during their release to avoid sharp reversals.
Forex trading beginners should remember that not every trade will be profitable. Developing a clear strategy and practicing proper money management are essential for long-term trading success.